Gallery
The following figures were plotted by using Matplotlib package unless otherwise stated.
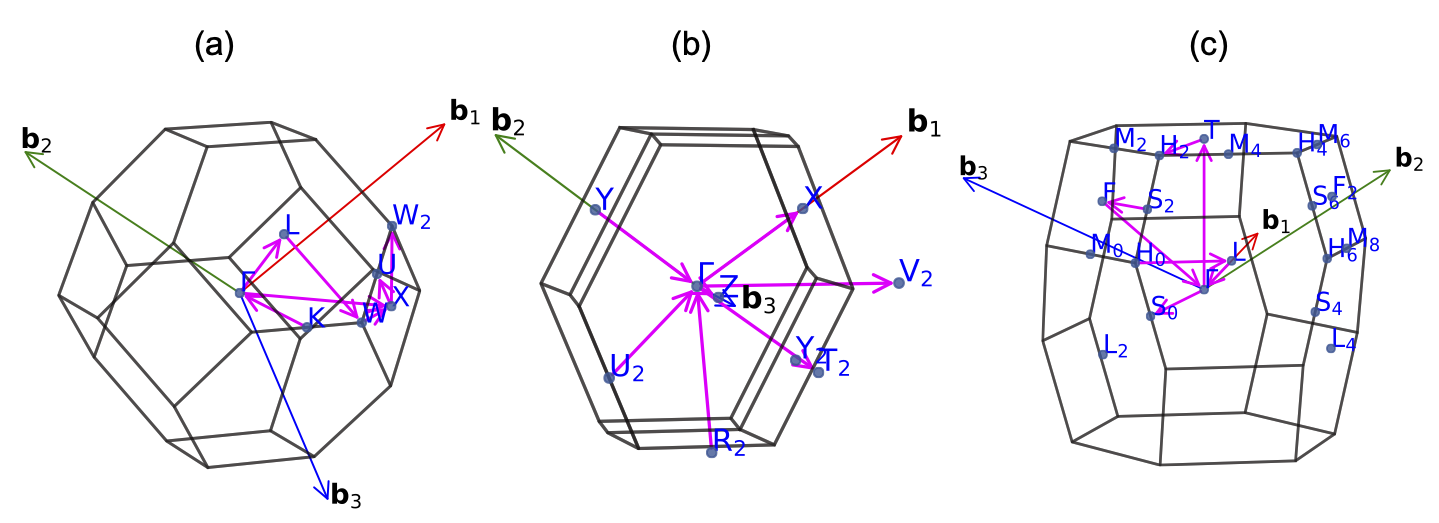
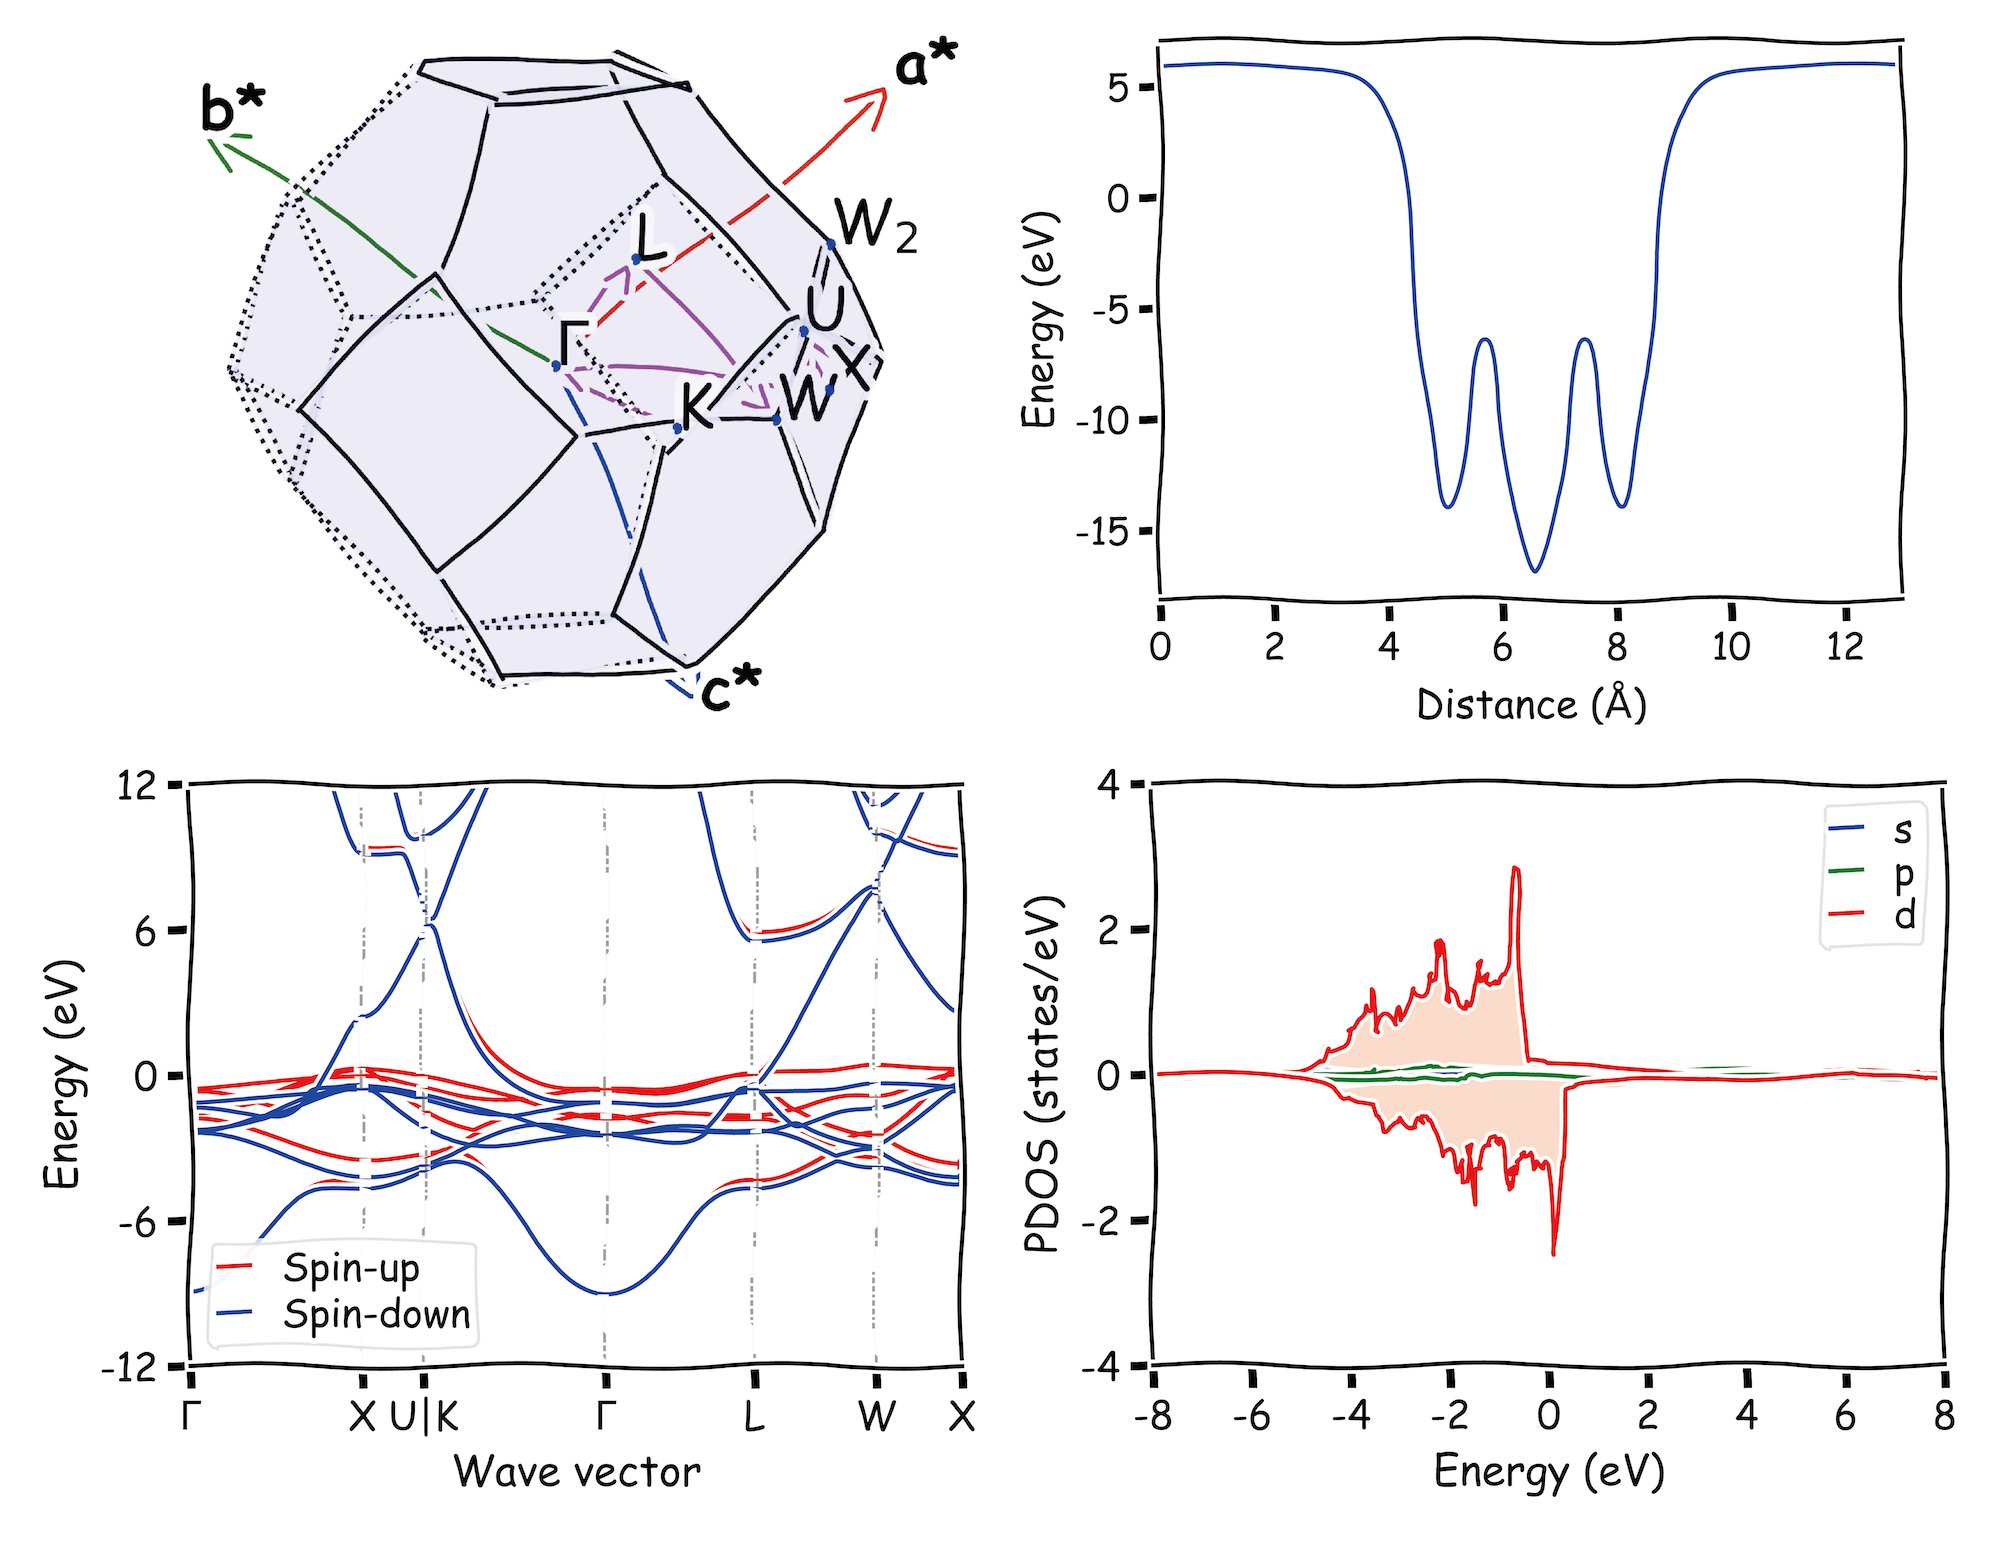
Suggested k-path in first Brillouin zone
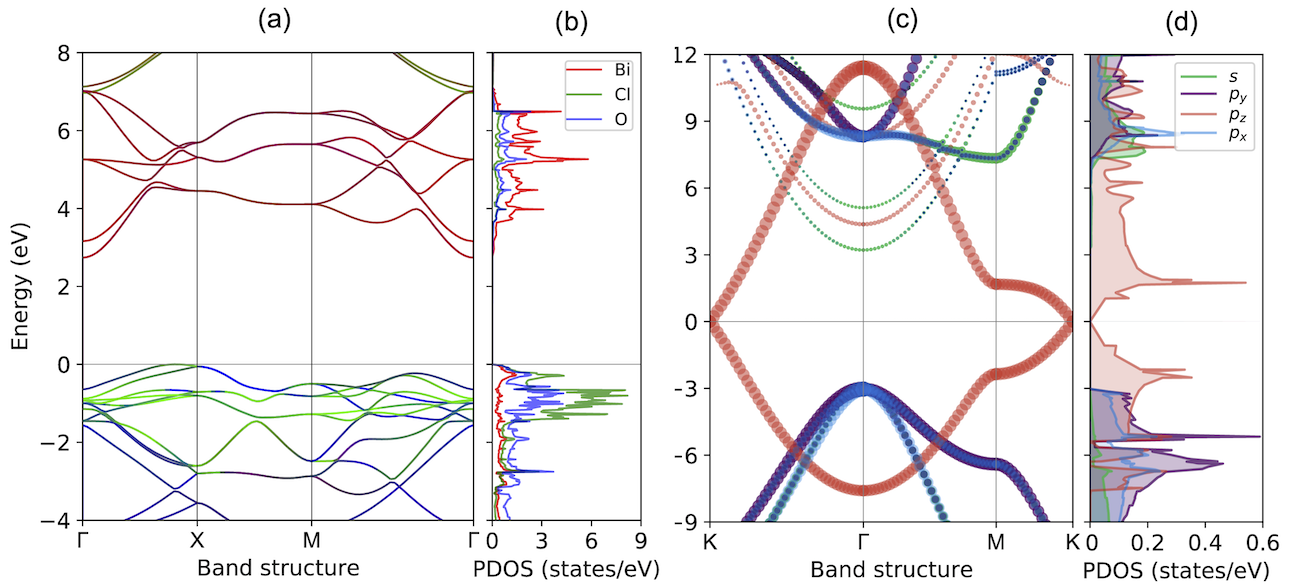
Band structure and density of states
K-resolved density of states
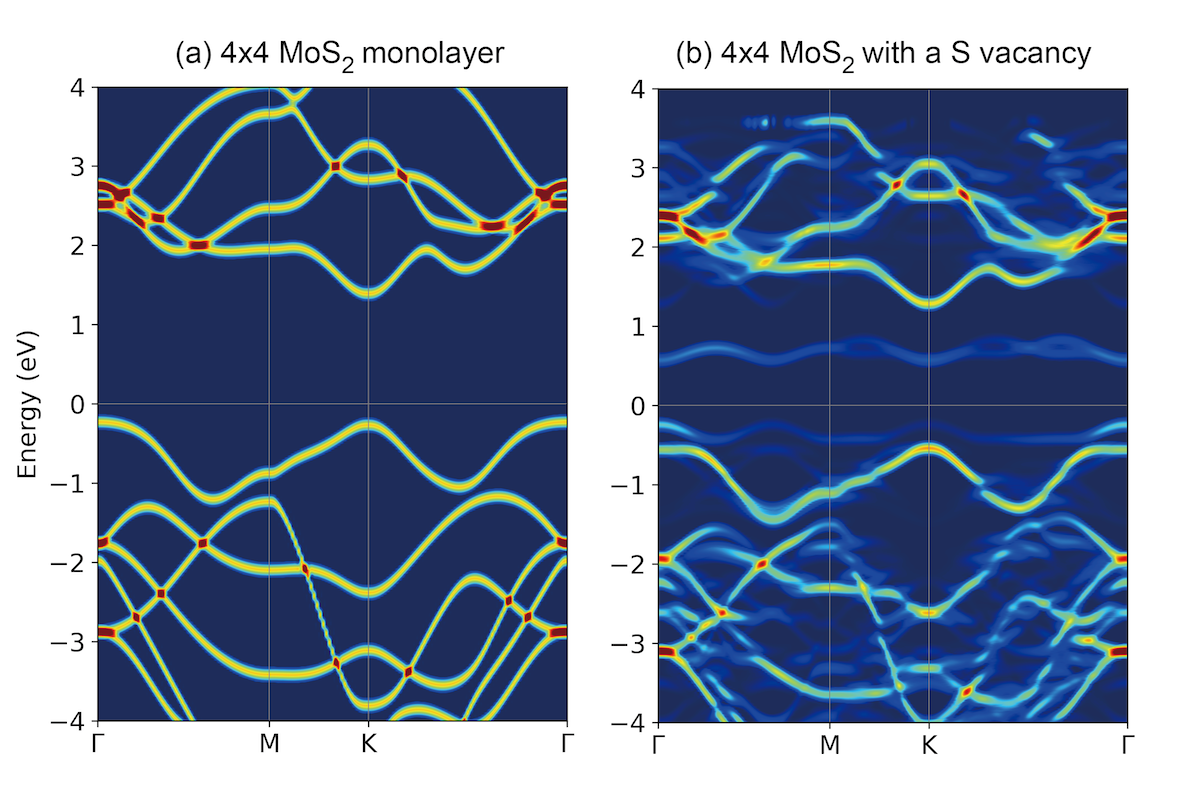
Band structure unfolding
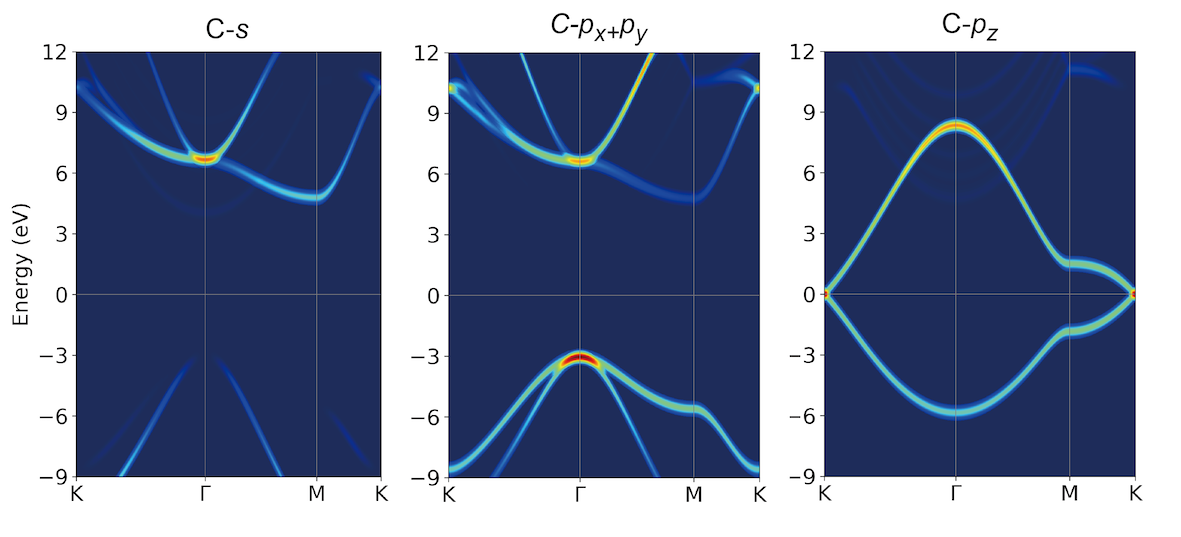
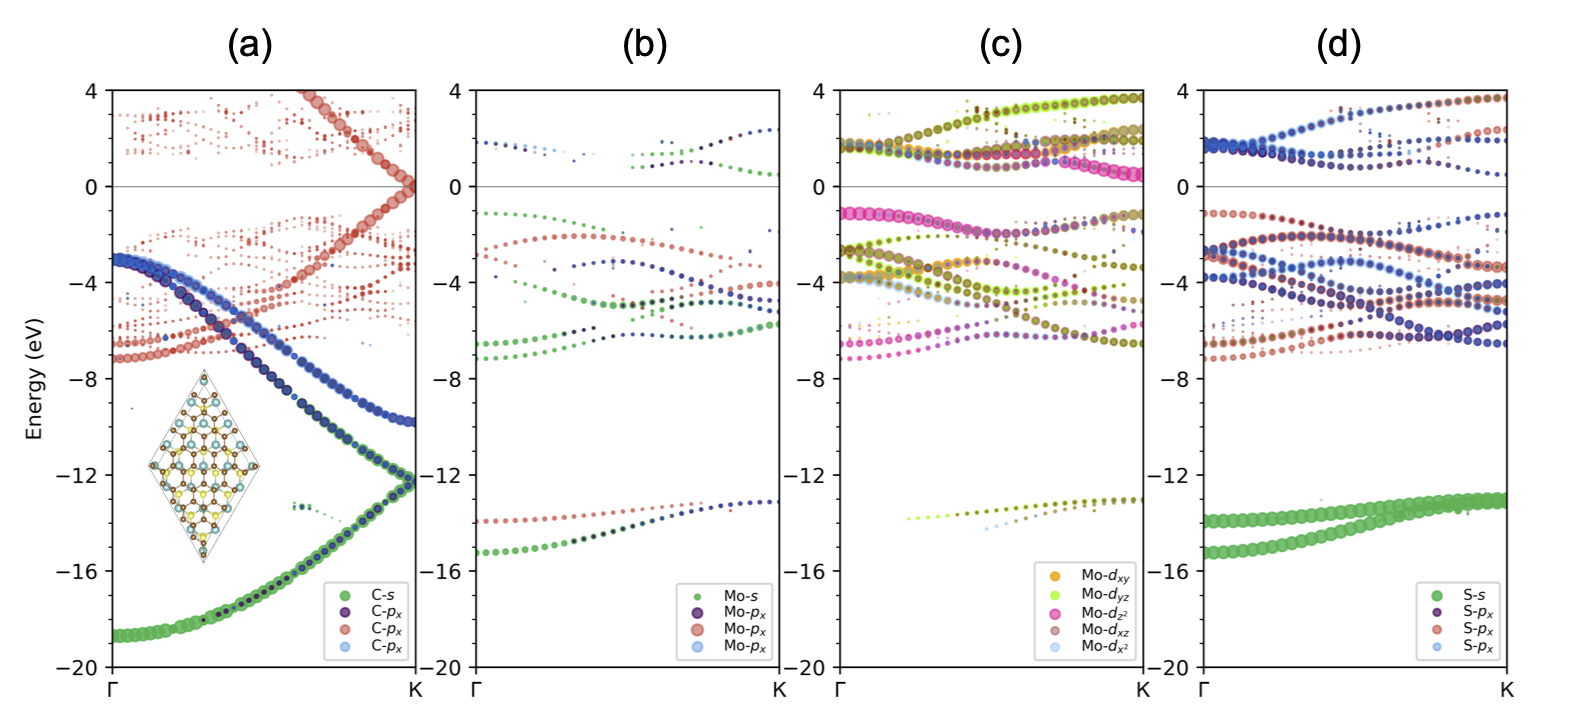
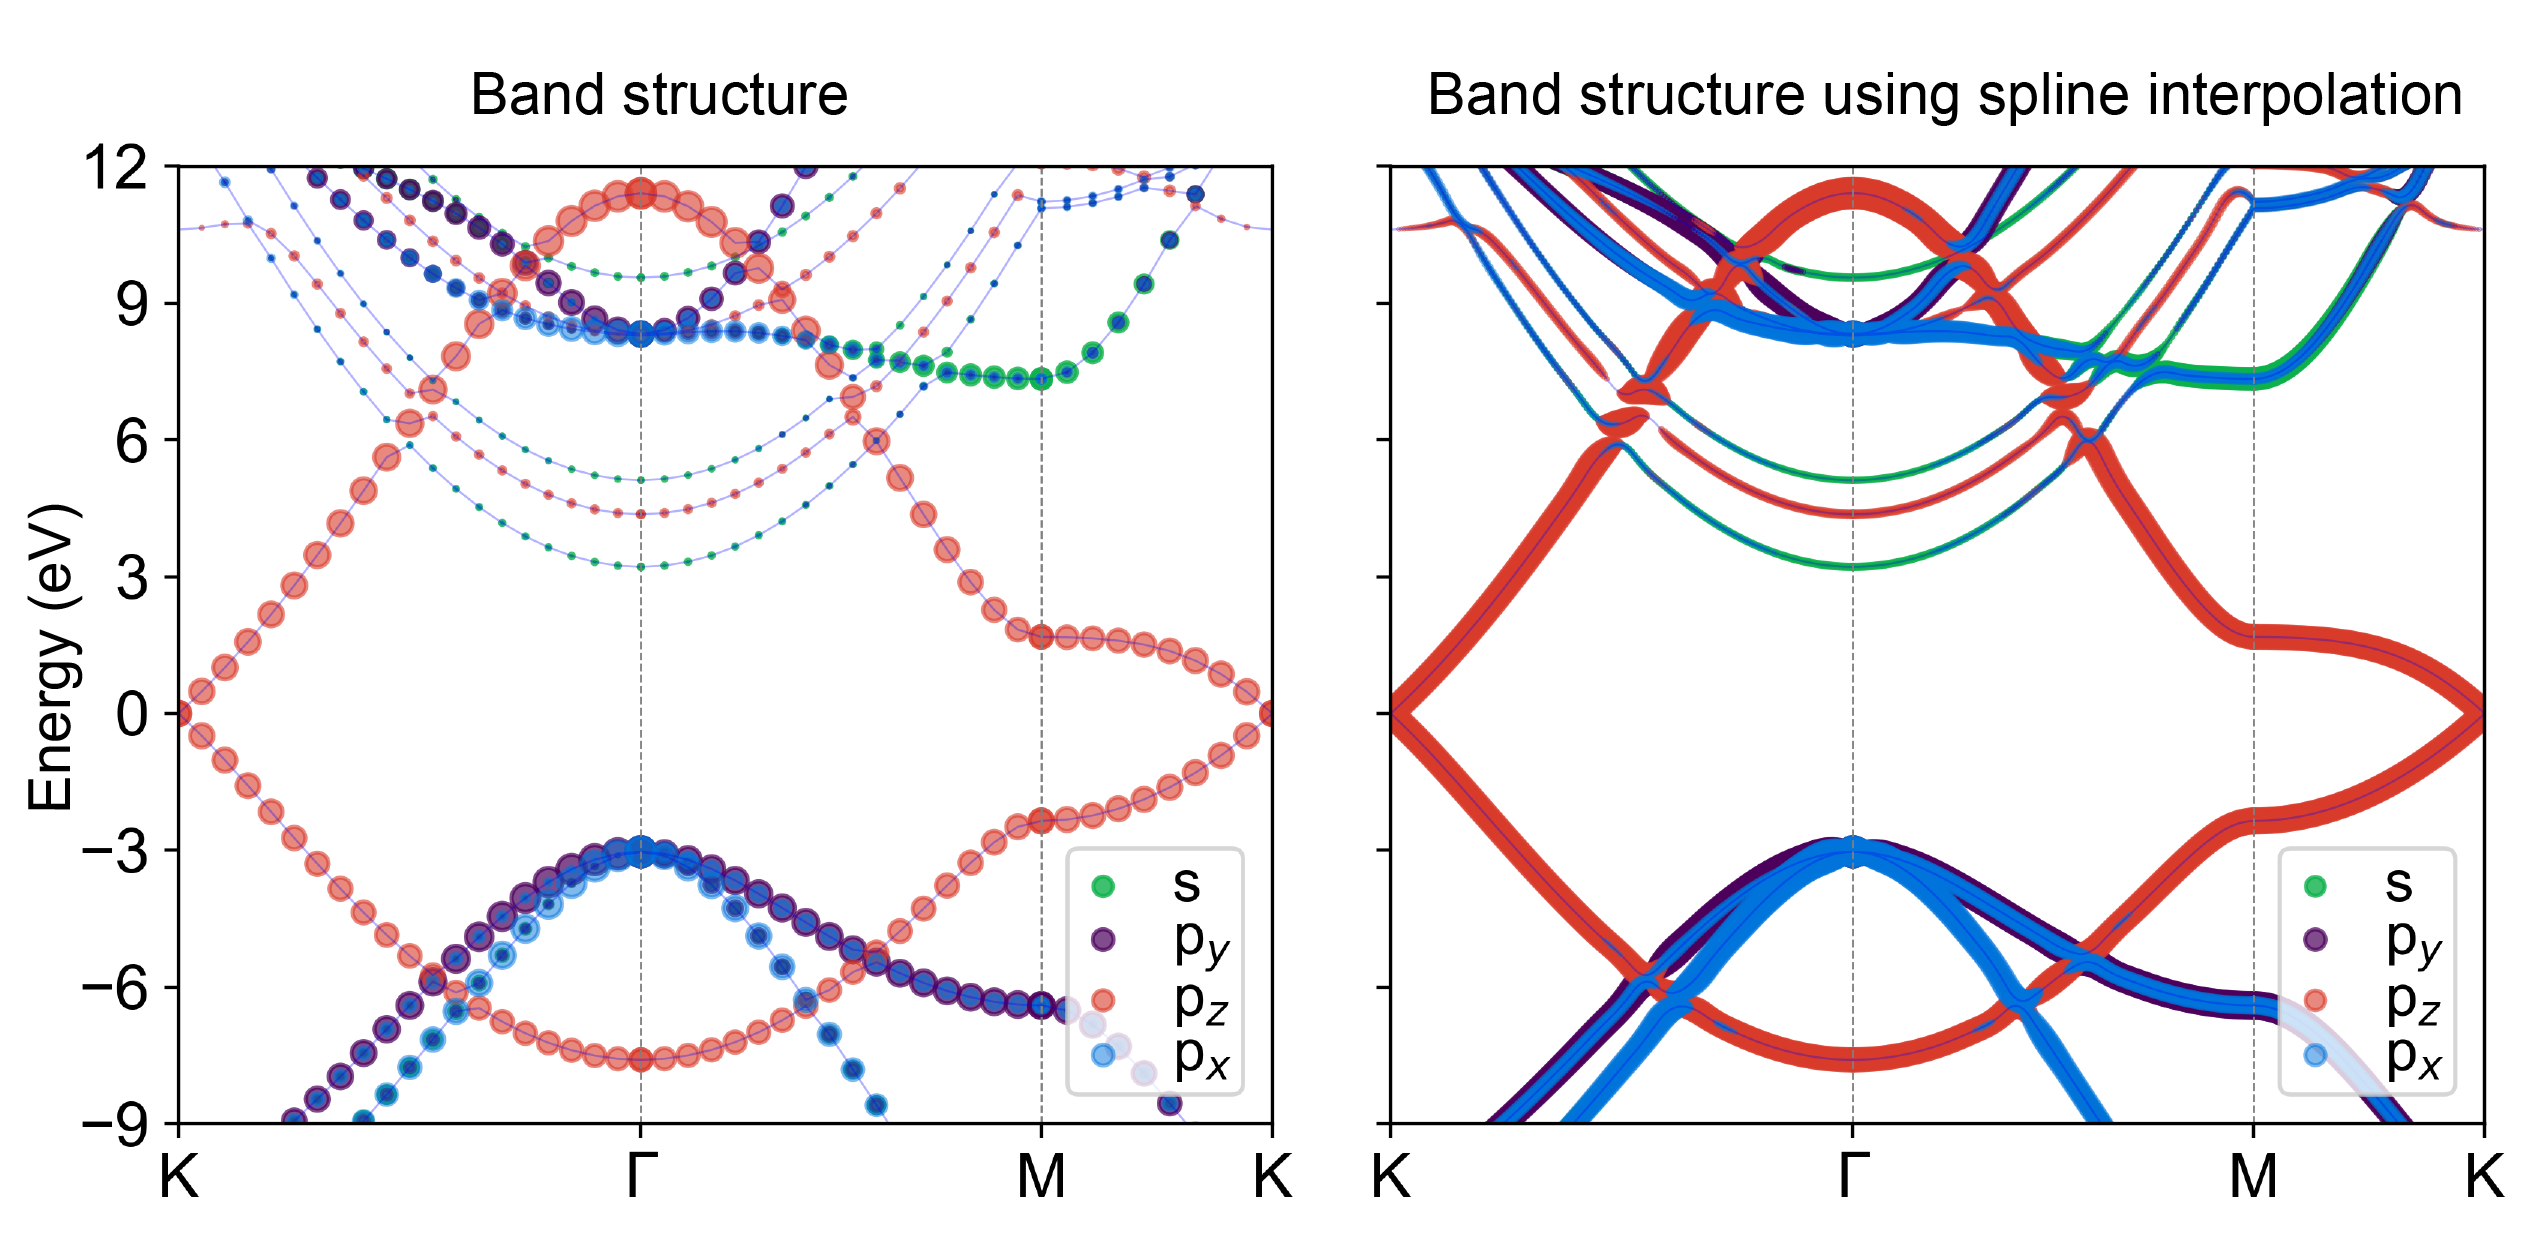
Orbital-projected band structure unfolding
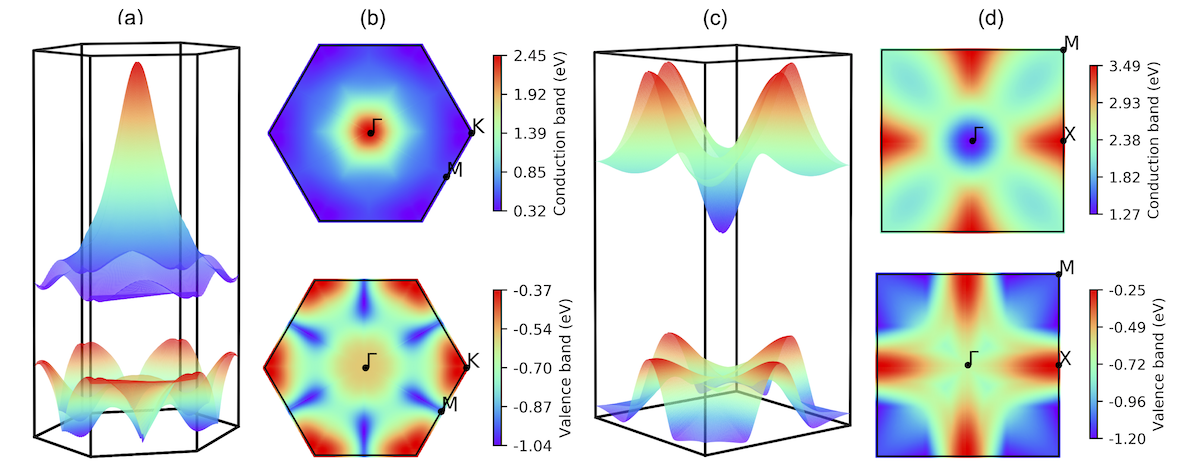
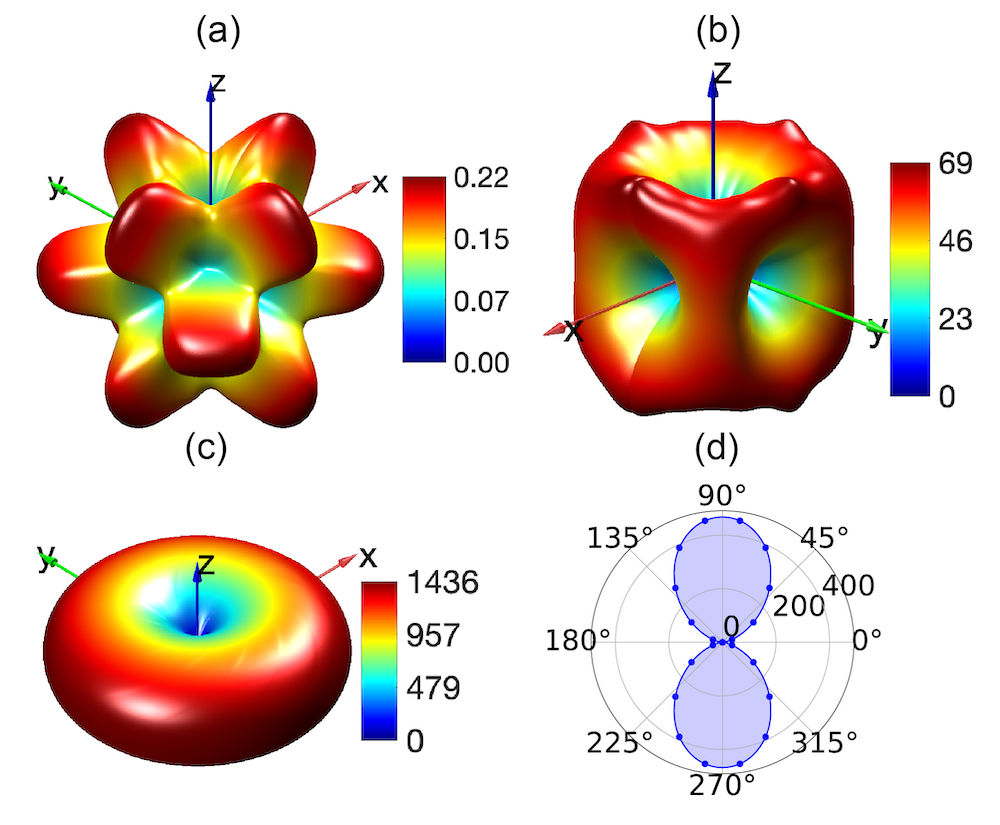
3D band structure
Fermi surface (visualized by using FermiSurfer package)
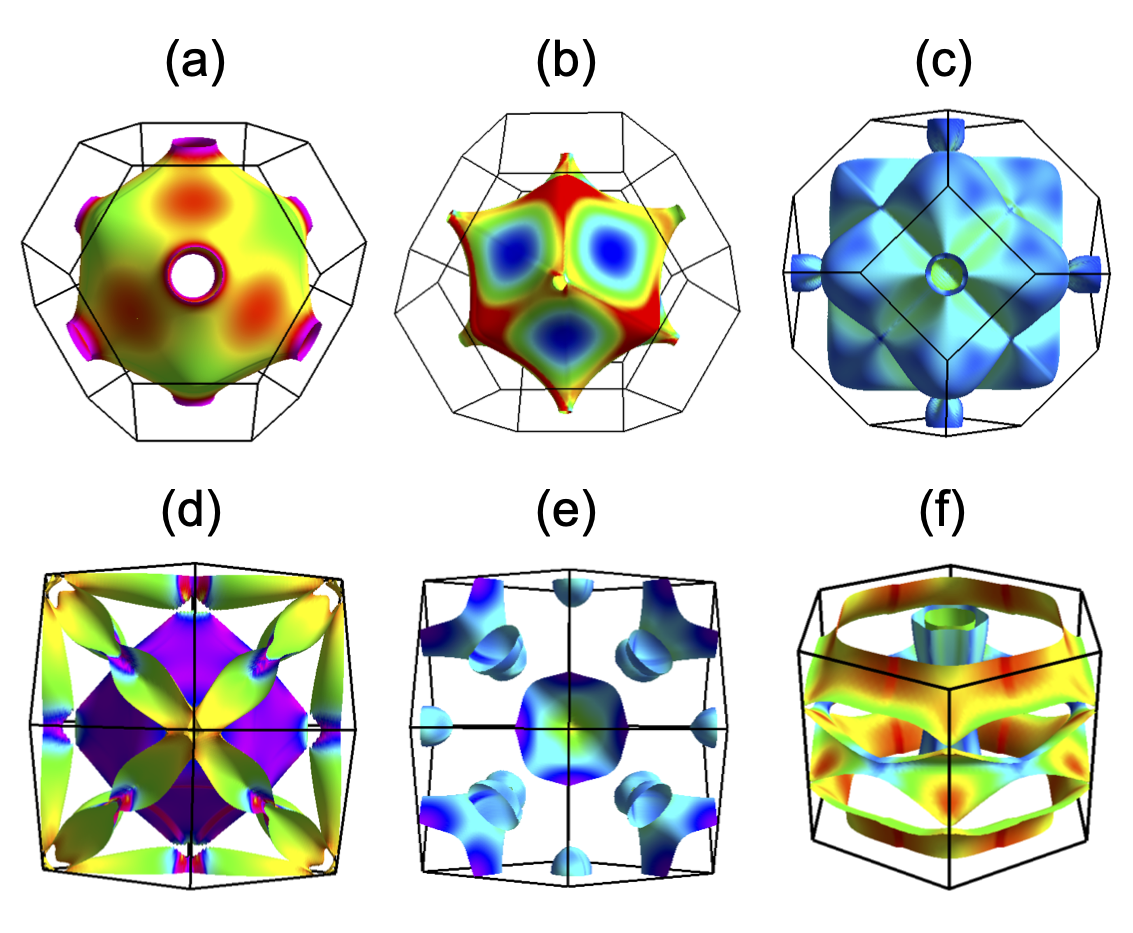
Orbital-projected Fermi surface (visualized by using FermiSurfer package)

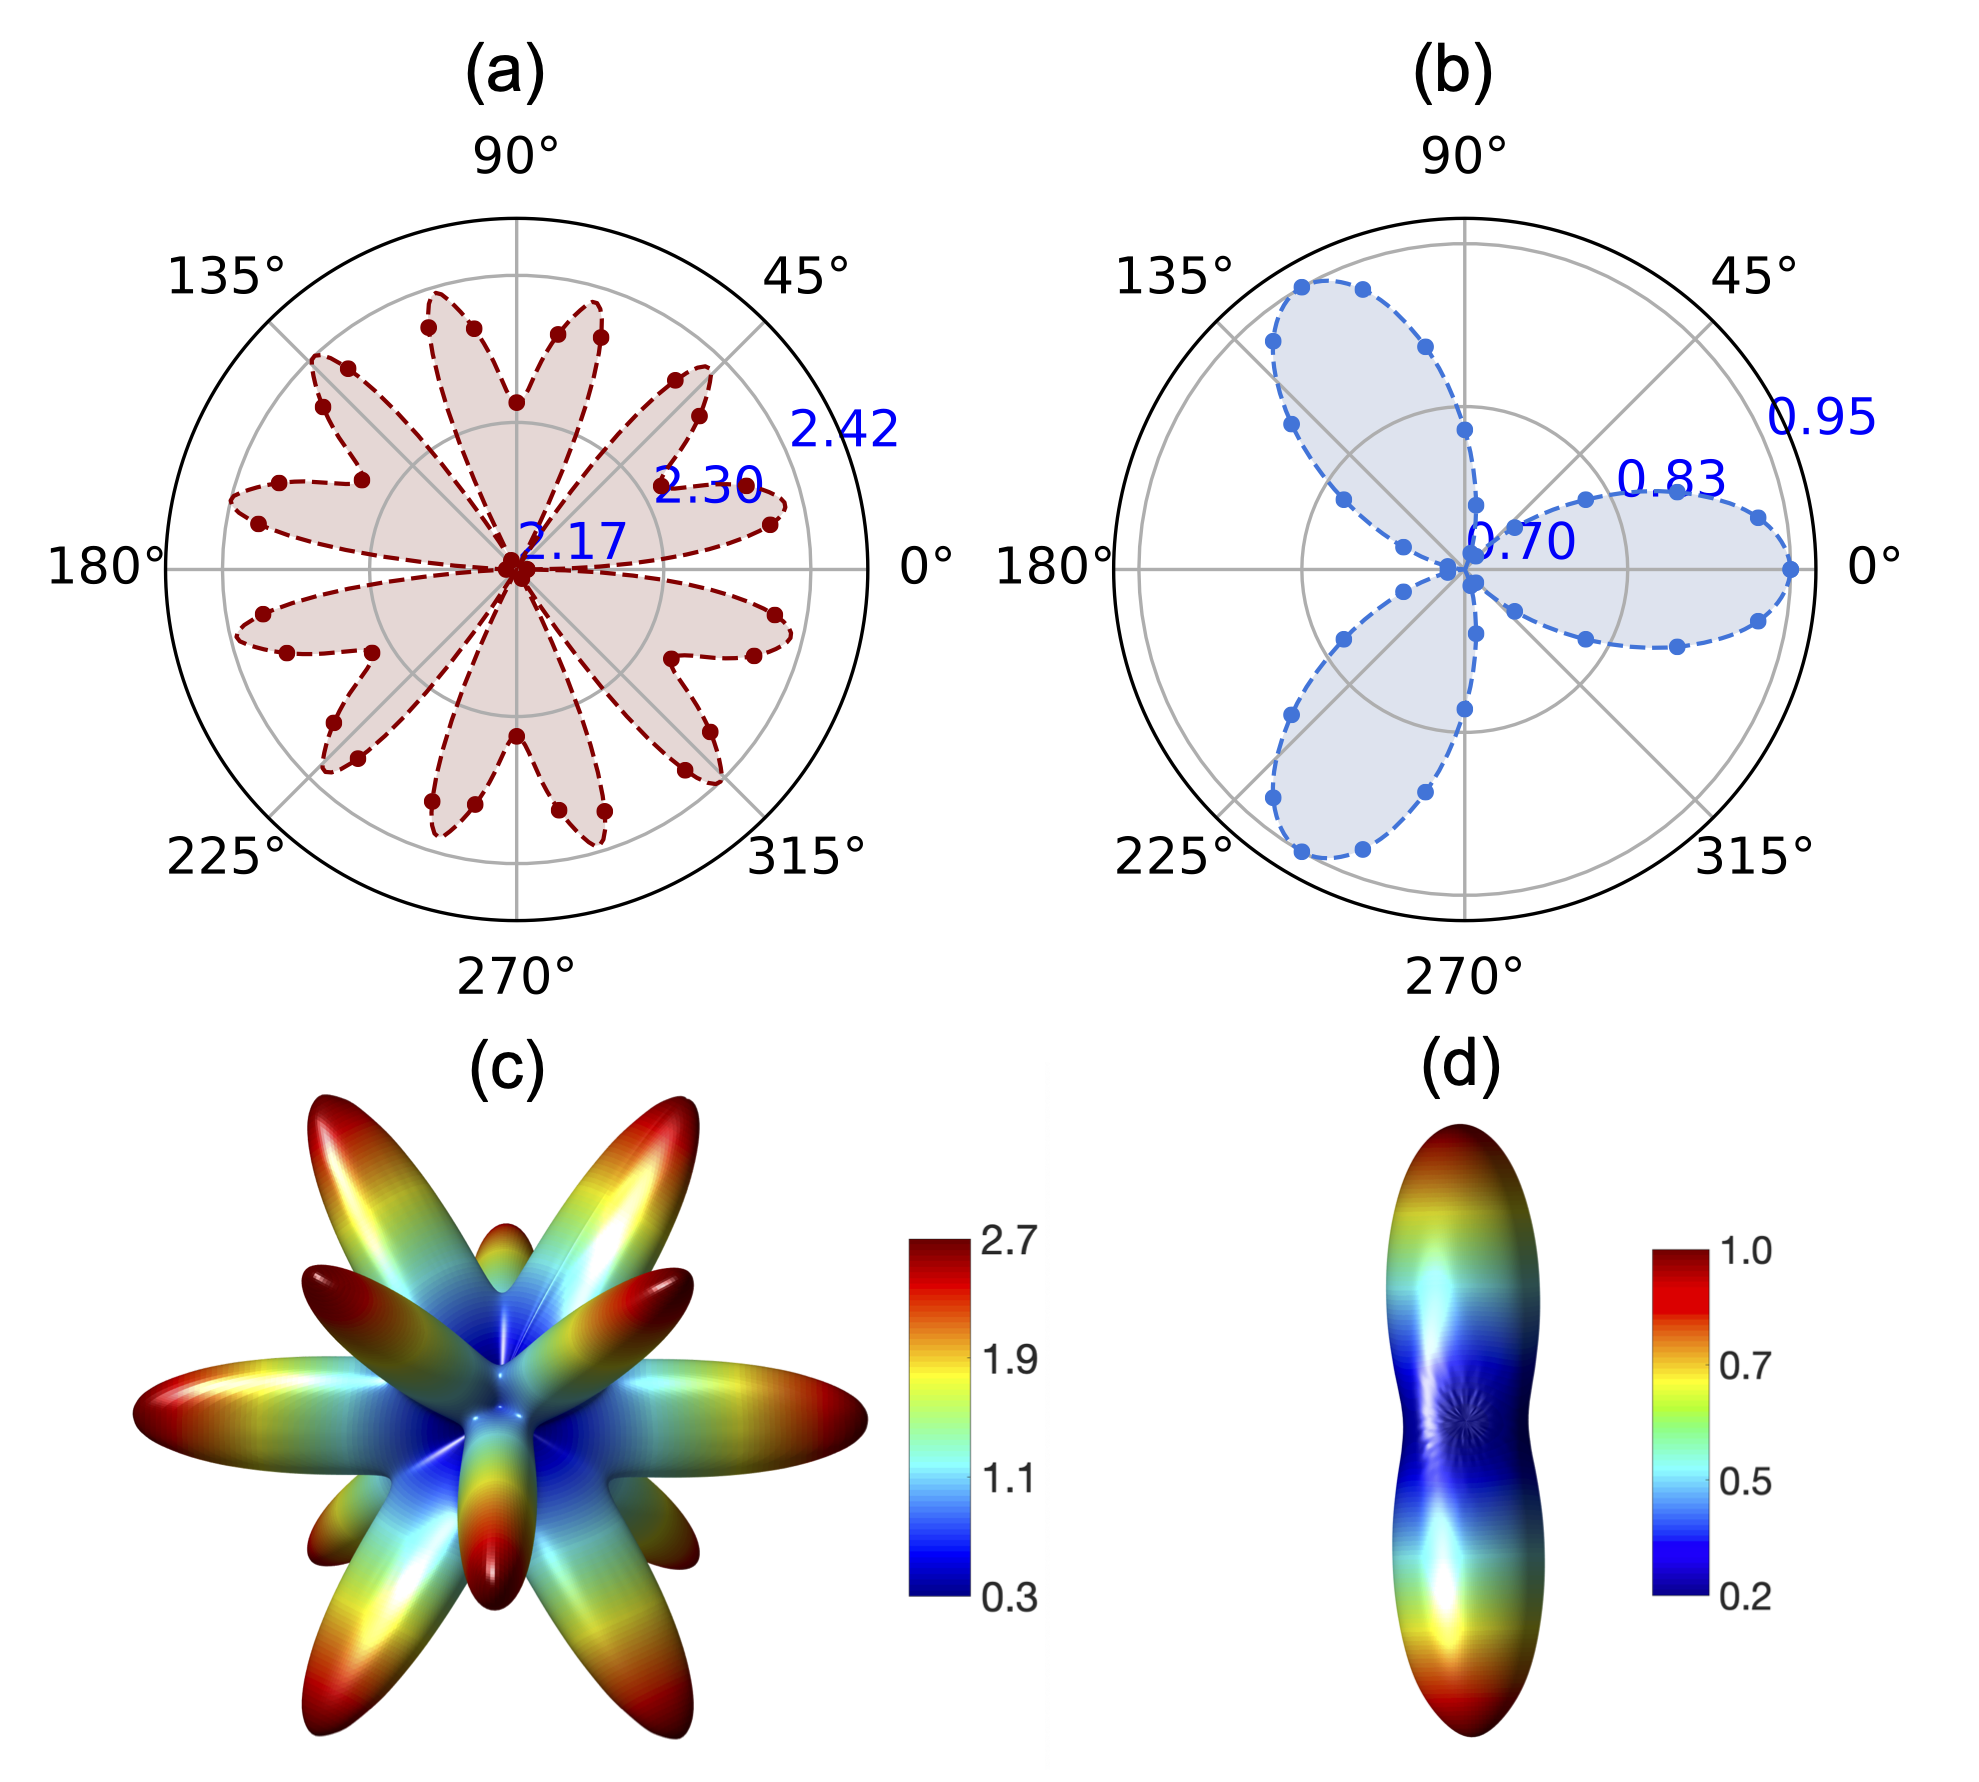
Angular-dependent effective mass
Magnetocrystalline Anisotropy Energy (MAE)
Scanning Tunneling Microscope (STM) simulation (Ver. 1.3.0 and later)

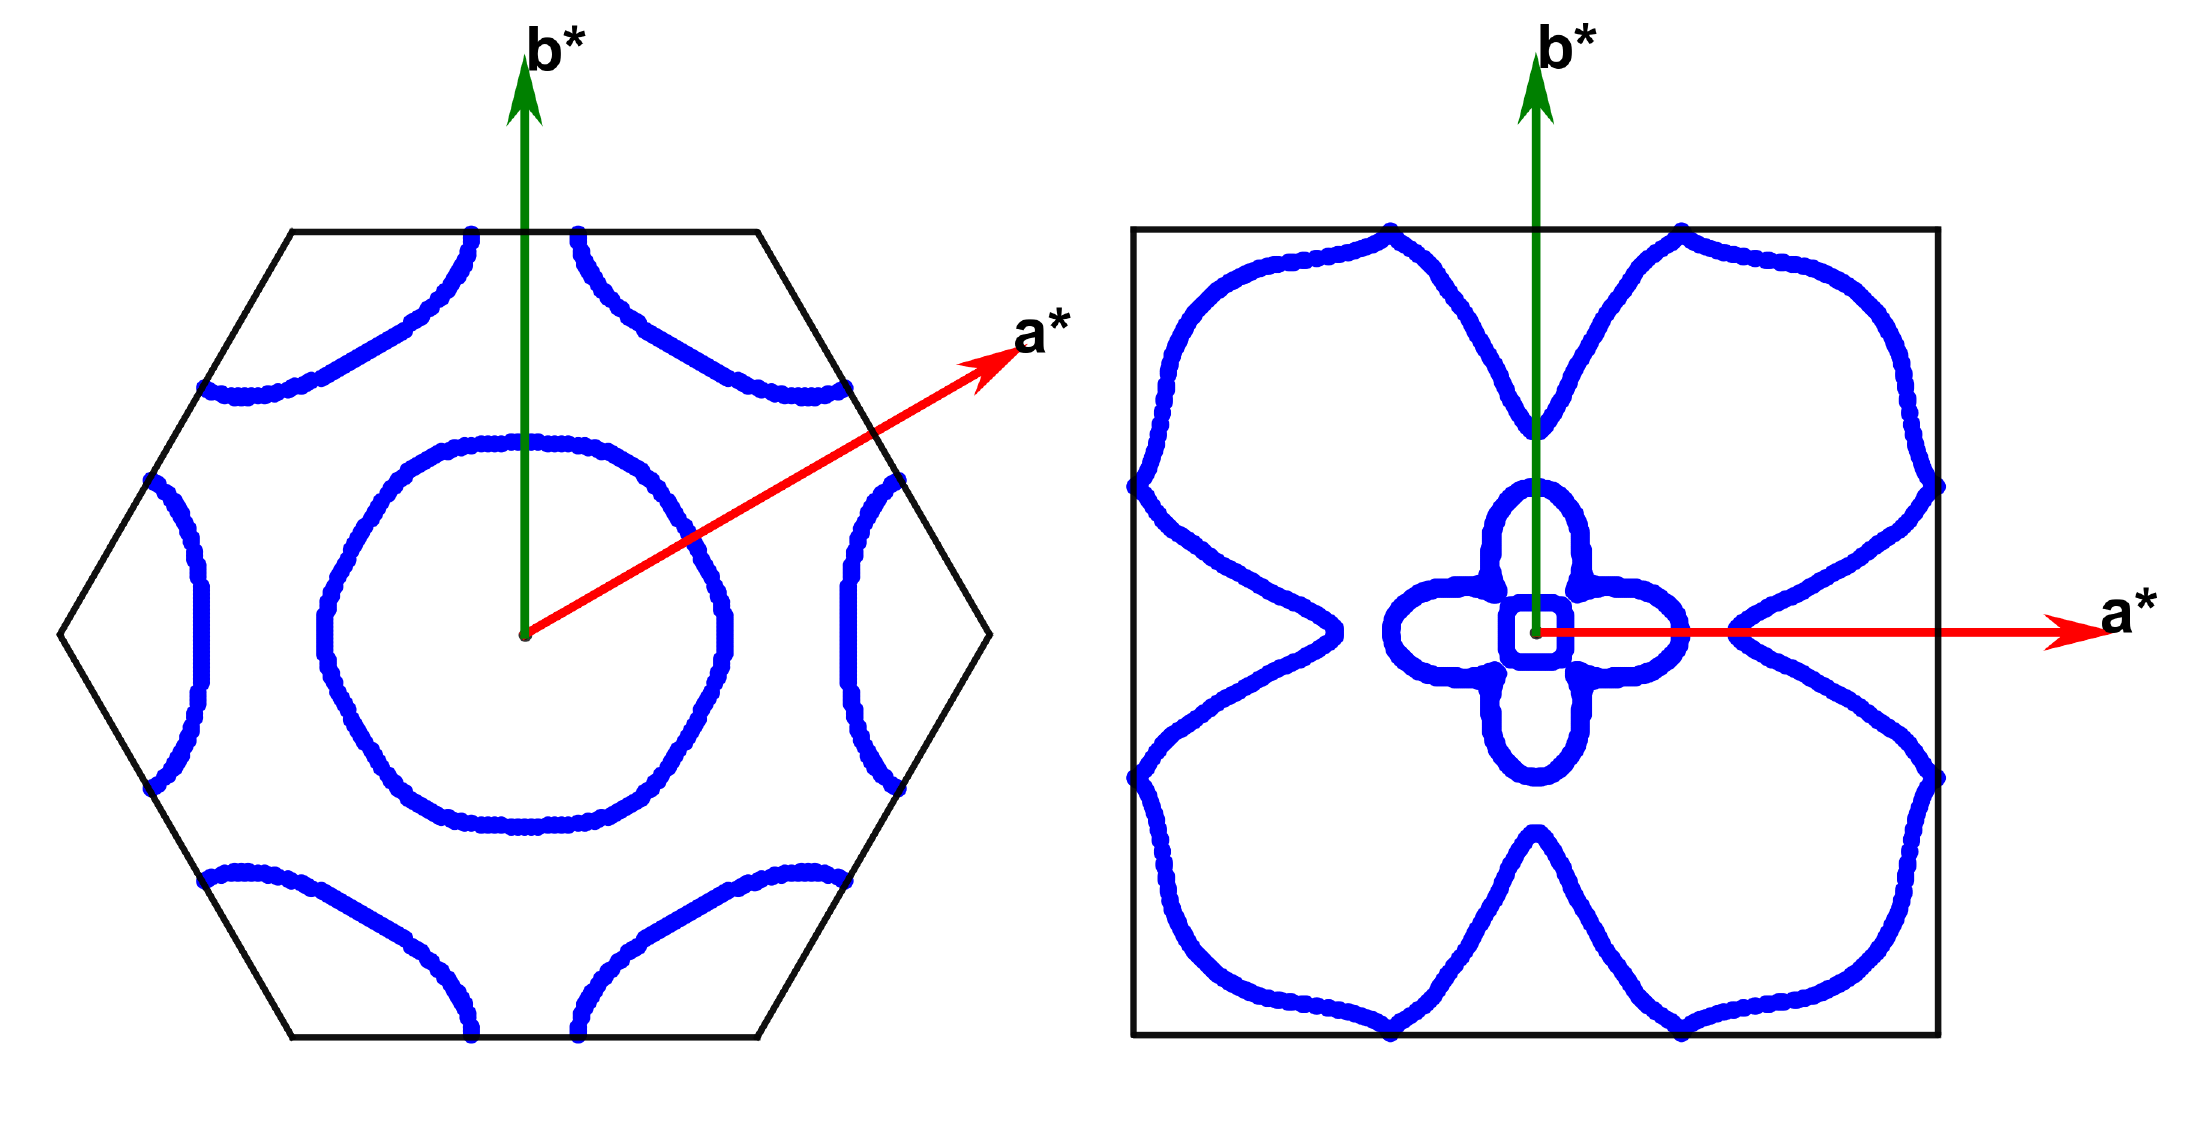
2D Fermi surface (Ver. 1.3.0 and later)
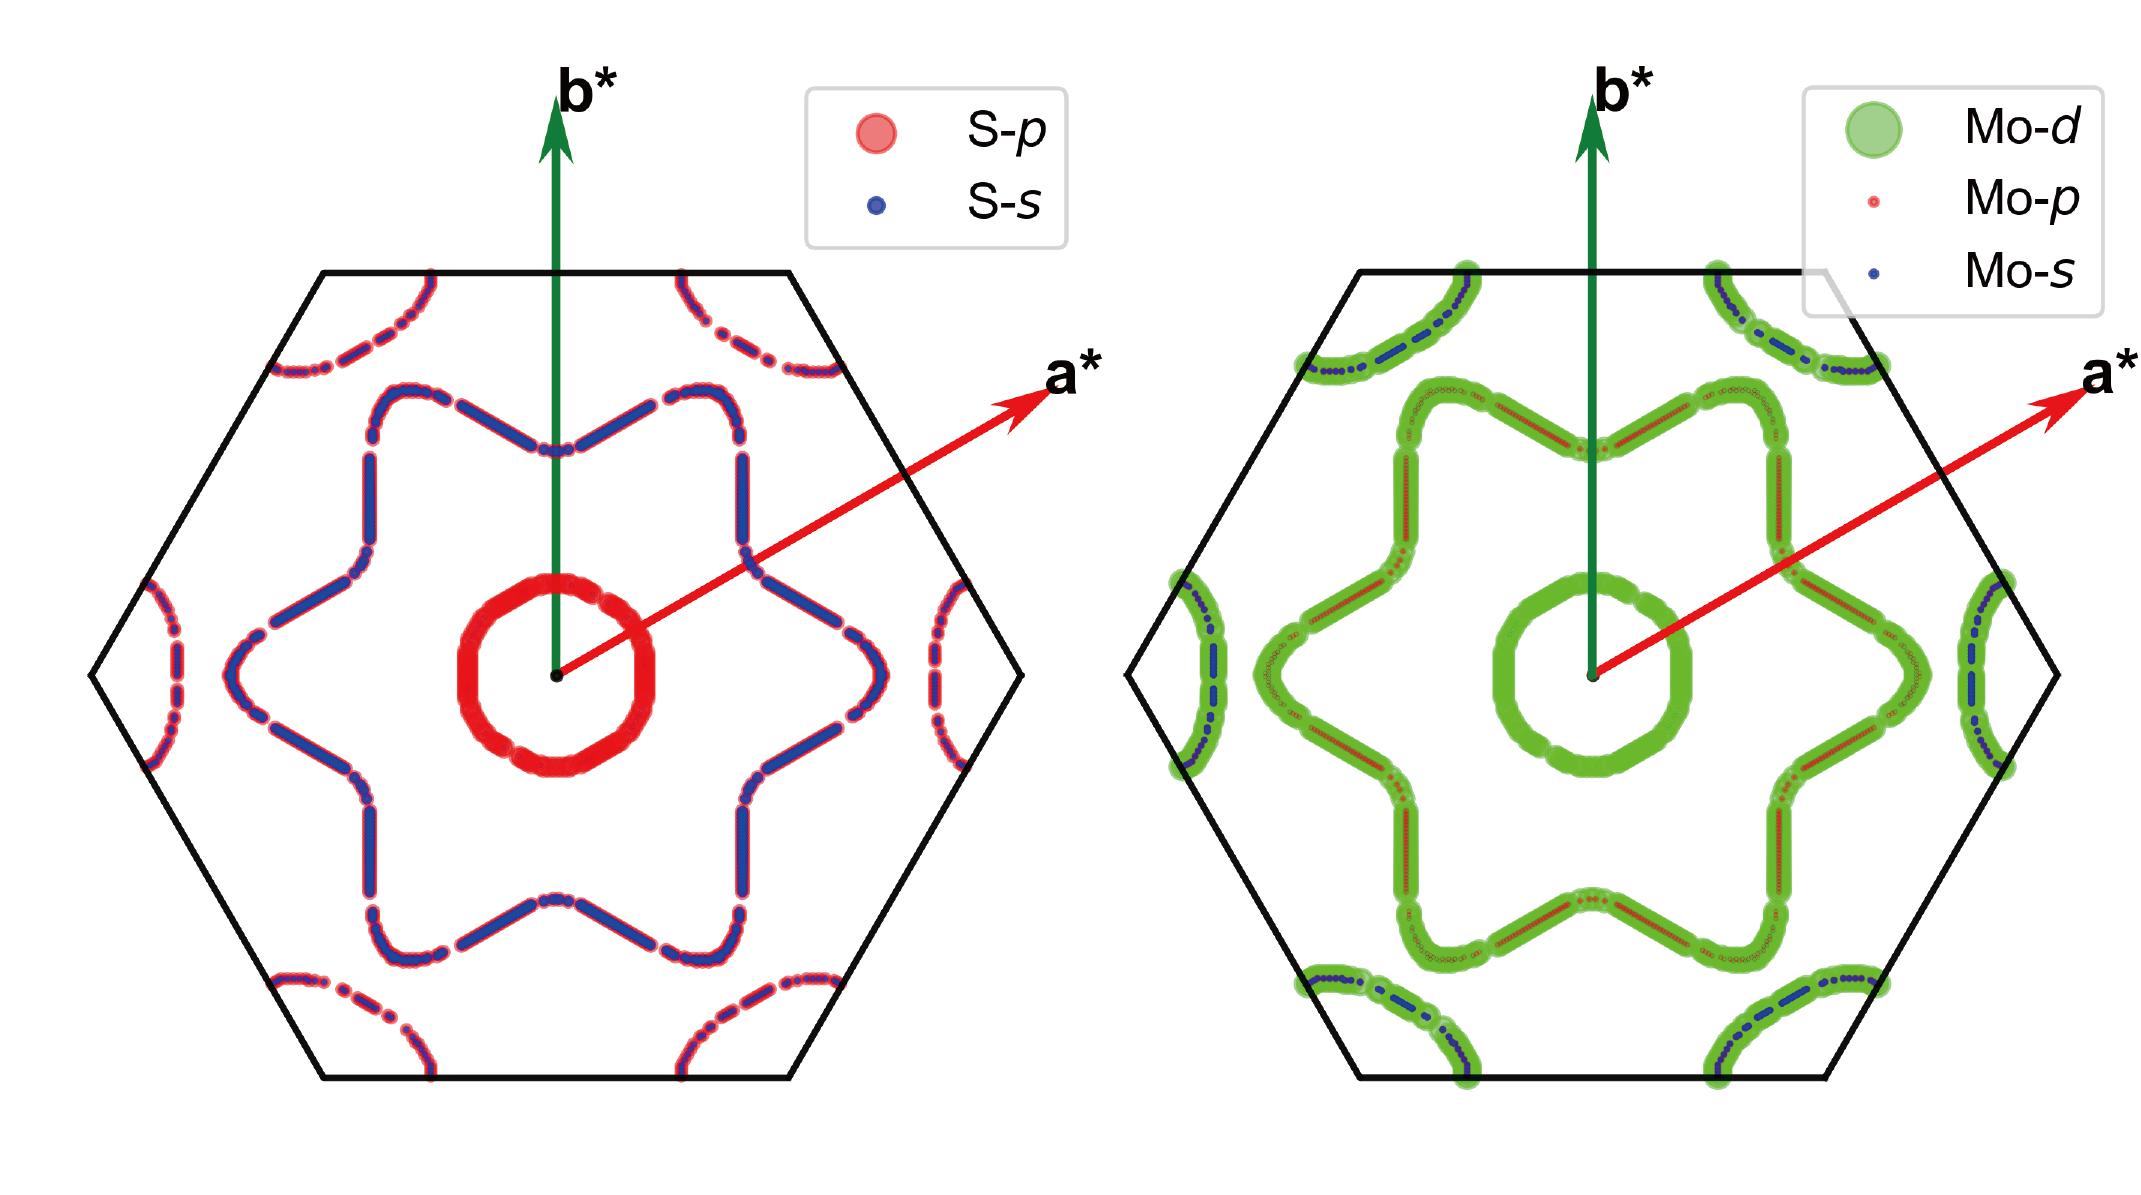
Orbital-projected 2D Fermi surface/constant energy contours of 3D band (Ver. 1.3.0 and later)
Interpolated band structure using spline algorithm (Ver. 1.3.0 and later)
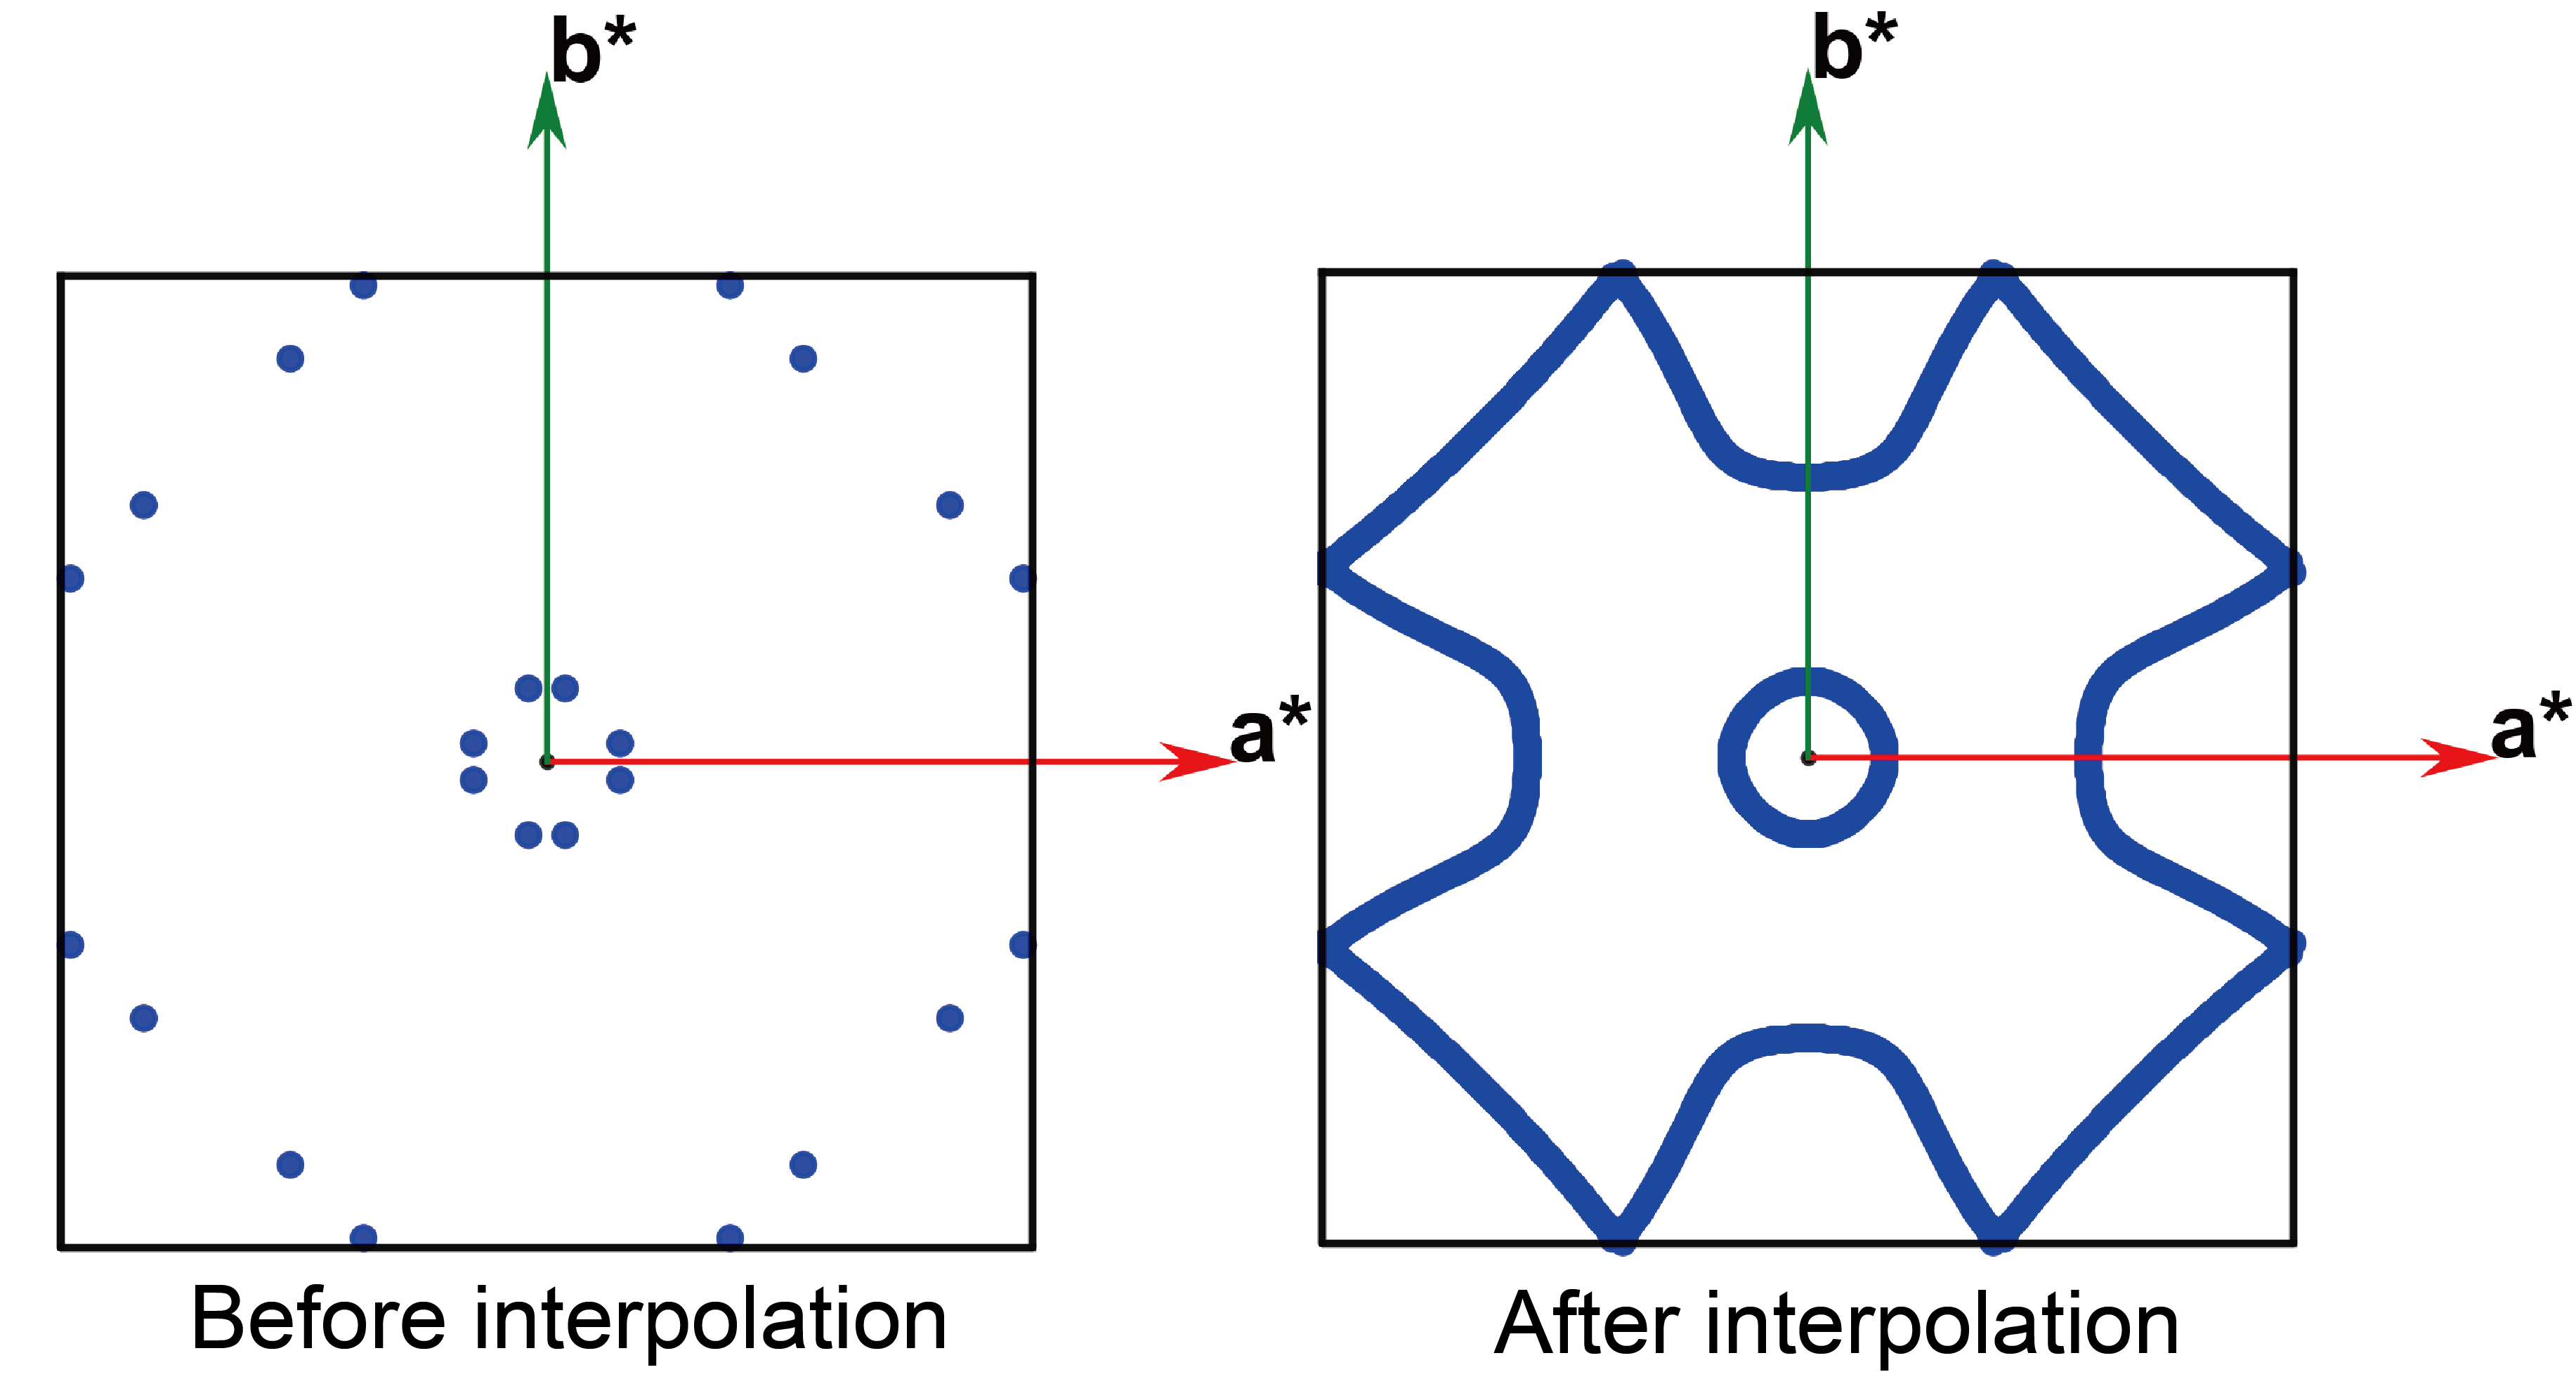
Interpolated 3D/2D Fermi surface using FFT or spline algorithm (Ver. 1.3.0 and later)
XKCD sketch-style (Ver. 1.3.0 and later)
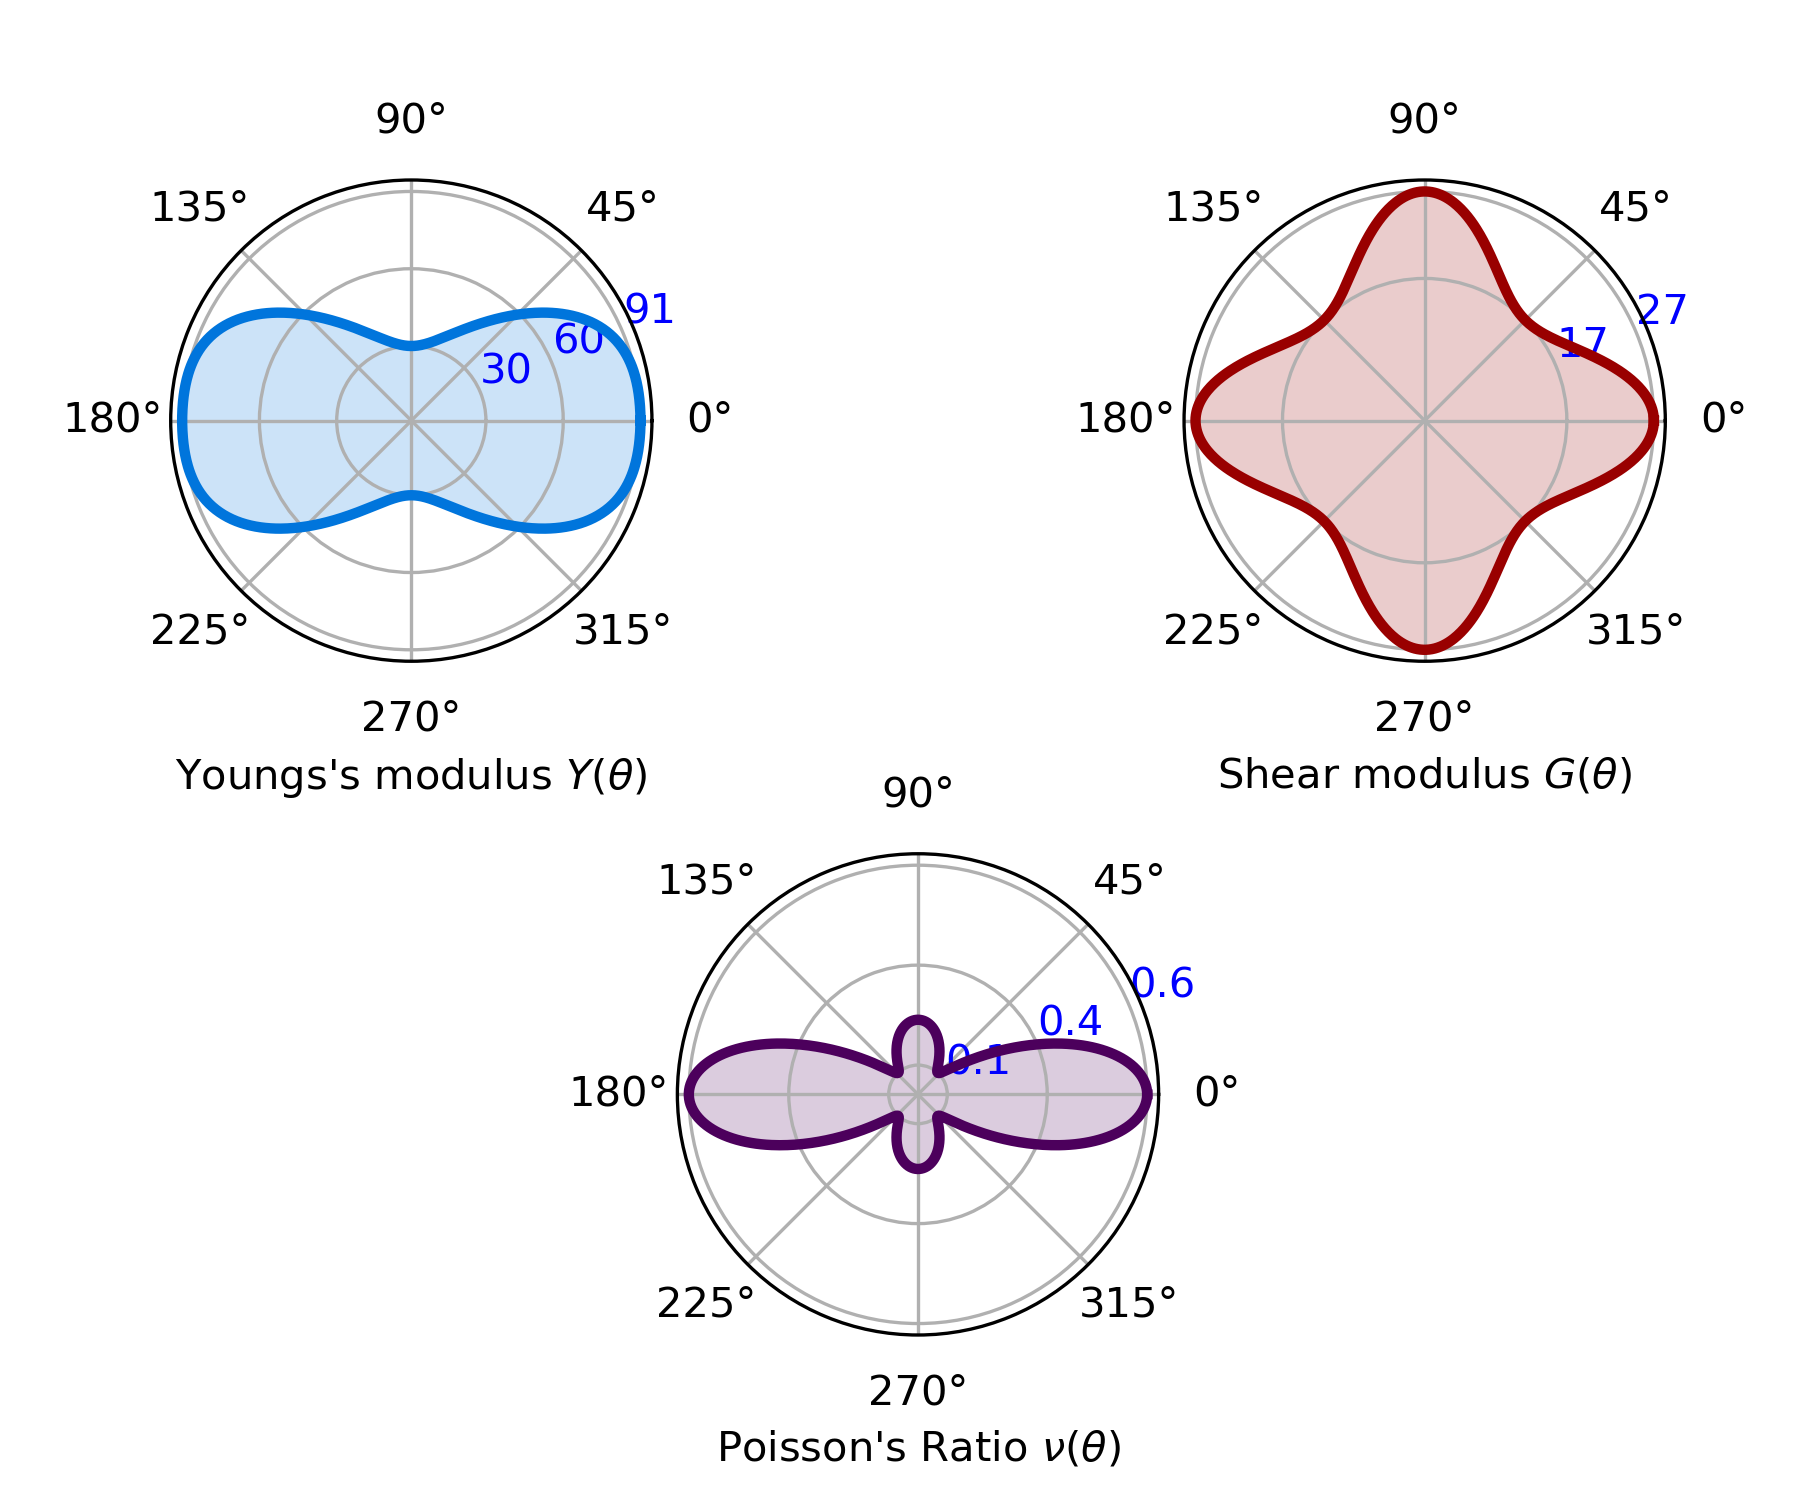
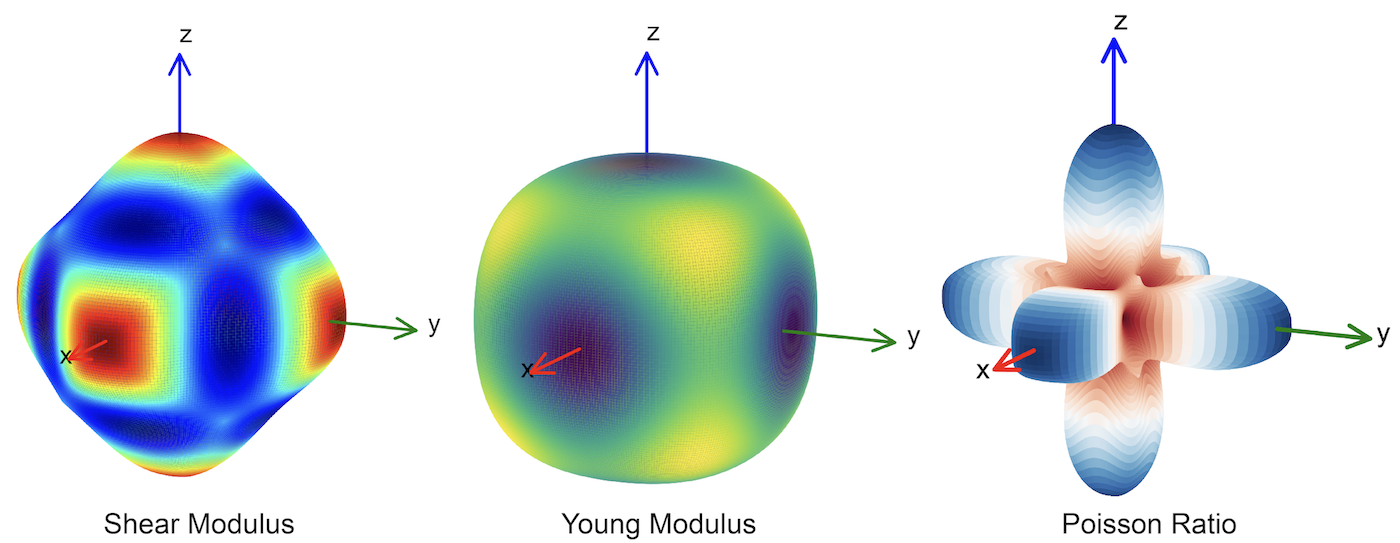
Angular-dependent mechanical properties (Ver. 1.3.0 and later)
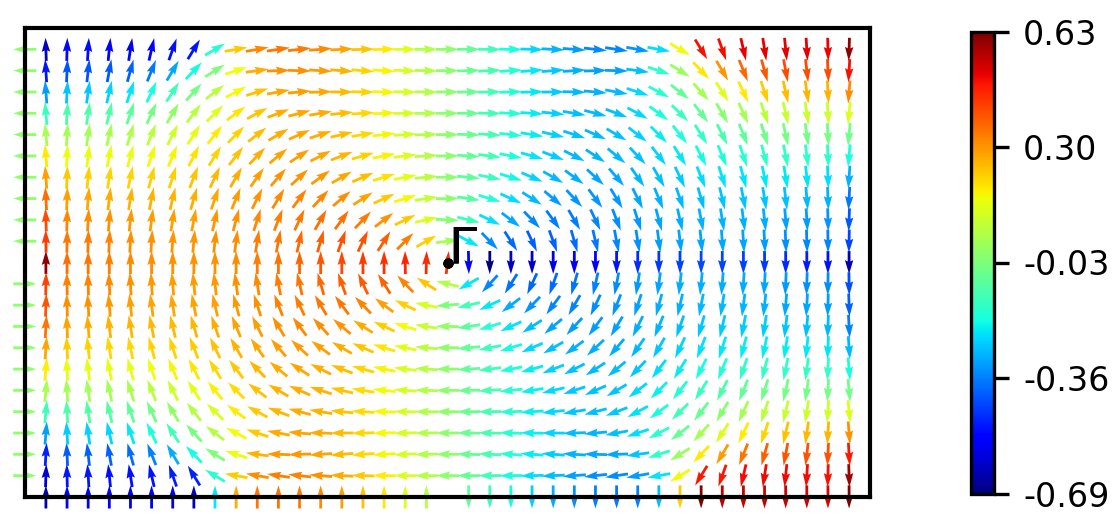
2D Spin-texture (Ver. 1.3.0 and later)
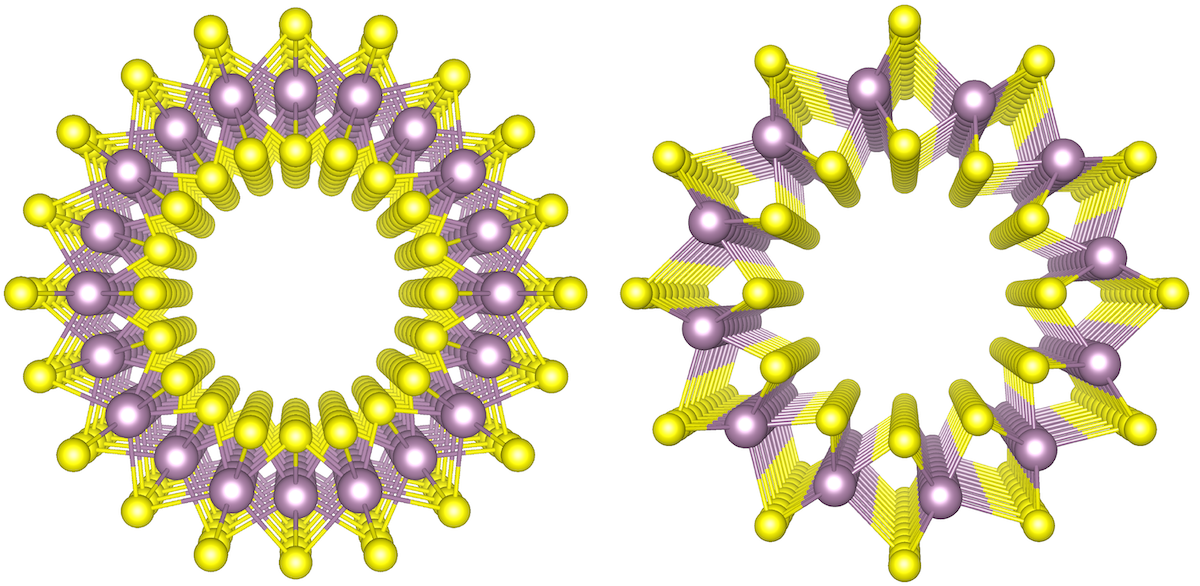
Nanotube (Ver. 1.3.0 and later)
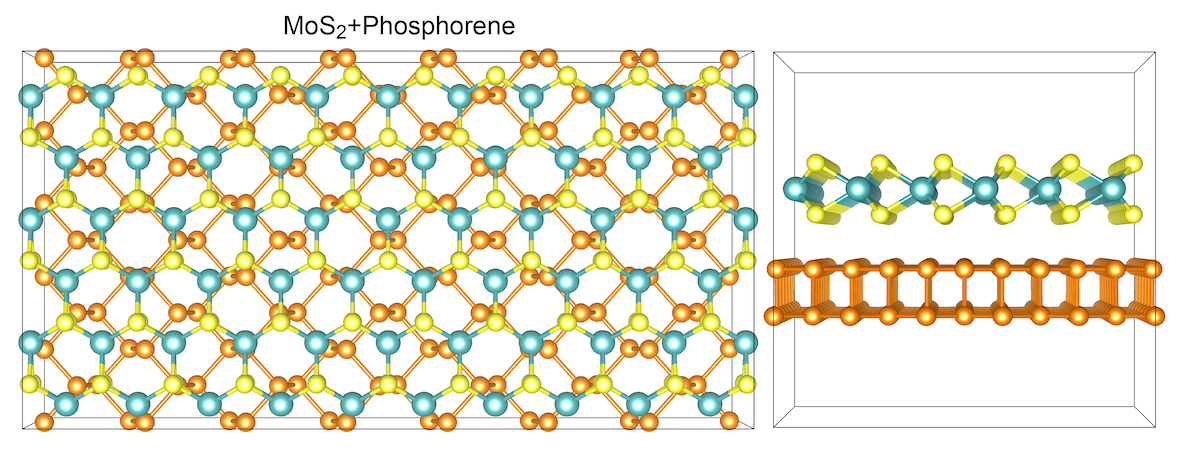
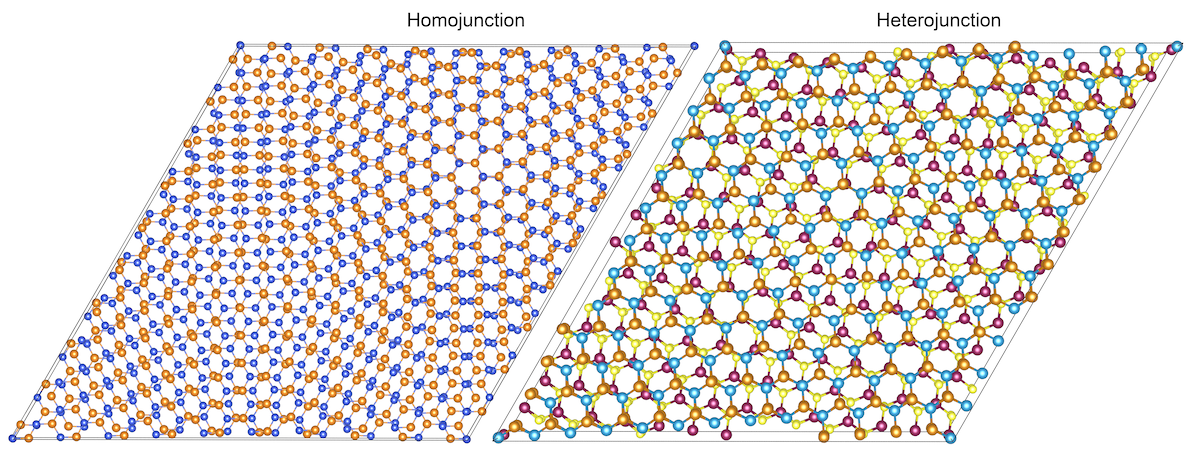
Heterojunction
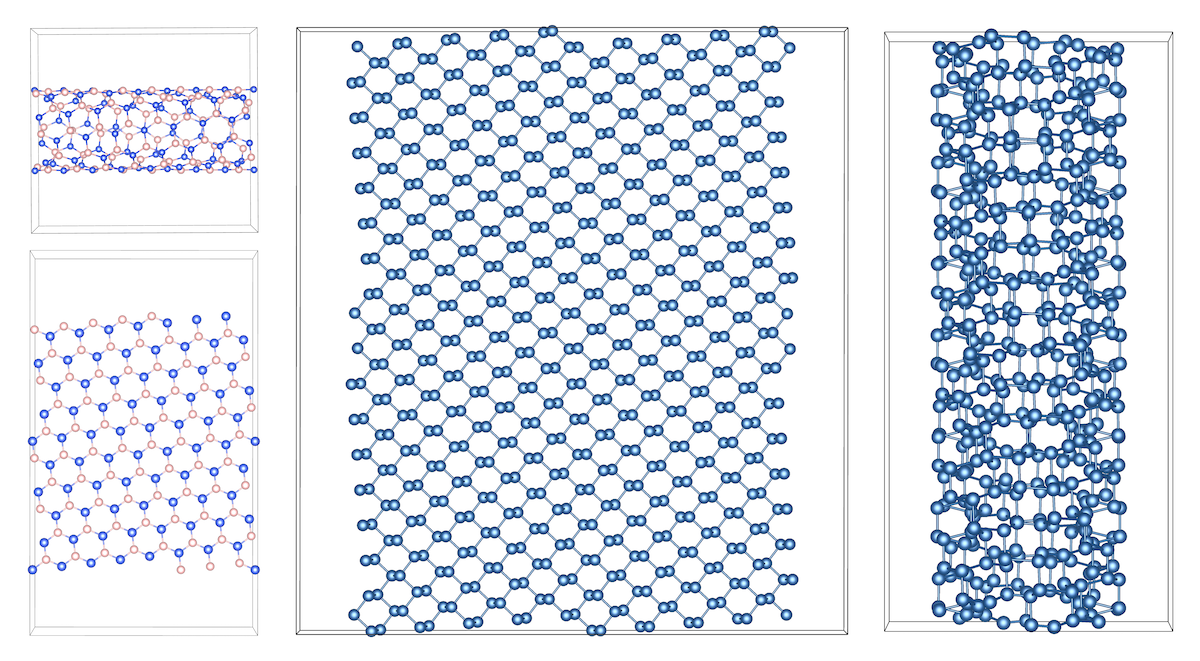
Nanotube and nanorribon with specified chiral vector (Pro Ver. 1.3.1 and later)
Hexagonal moire superlattices (Pro Ver. 1.3.1 and later)
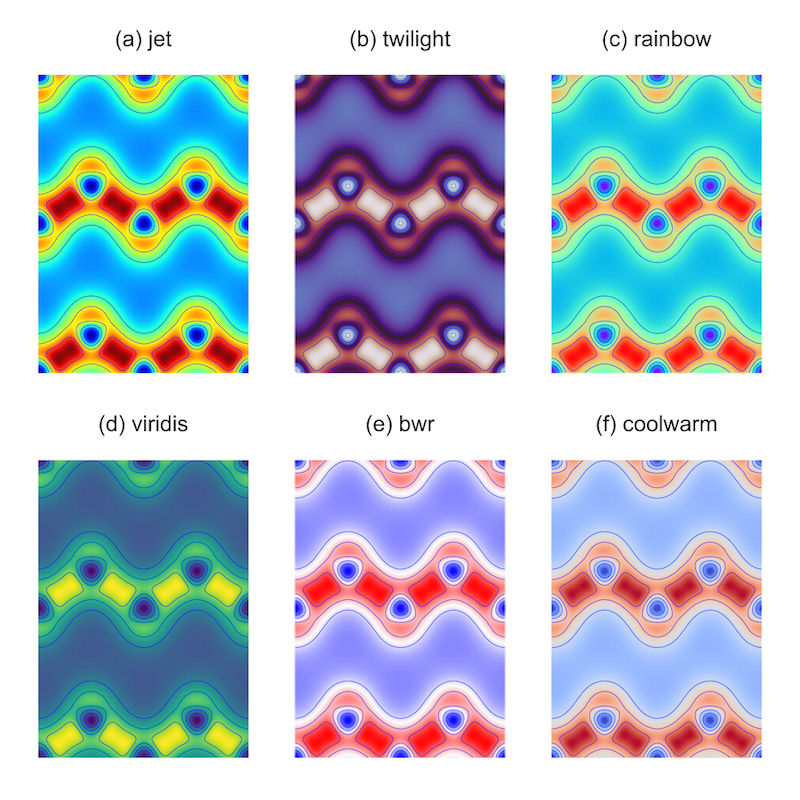
2D slice of charge density or potential (Ver. 1.4.0 and later)
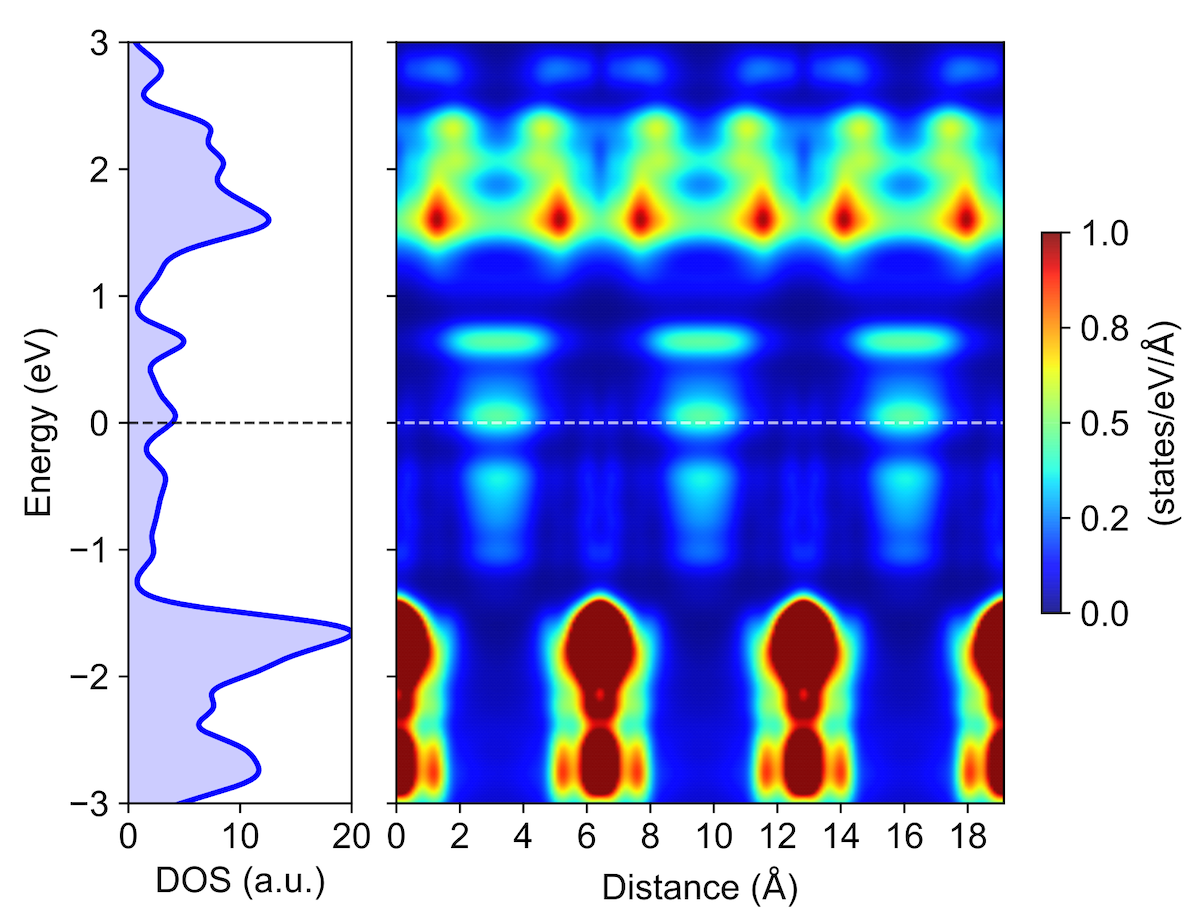
Spatially-resolved density of states (Ver. 1.4.0 and later)
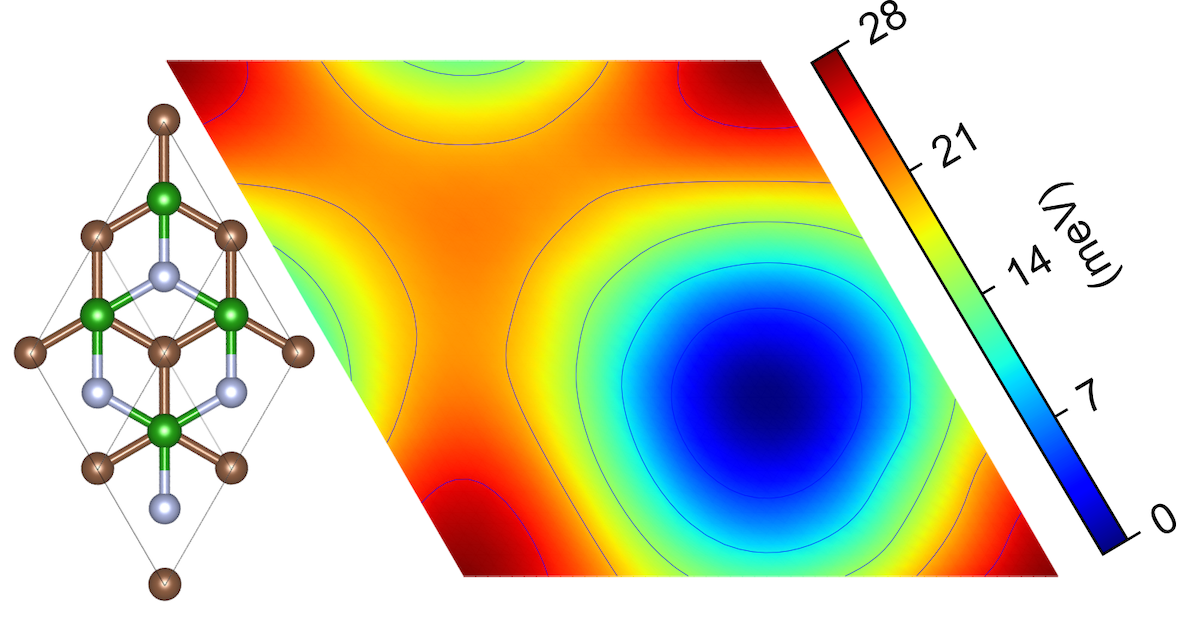
Stacking-dependent potential energy surface of few-layered nanosheets (Ver. 1.4.0 and later)
Angular-dependent elastic properties (Ver. 1.4.0 and later)
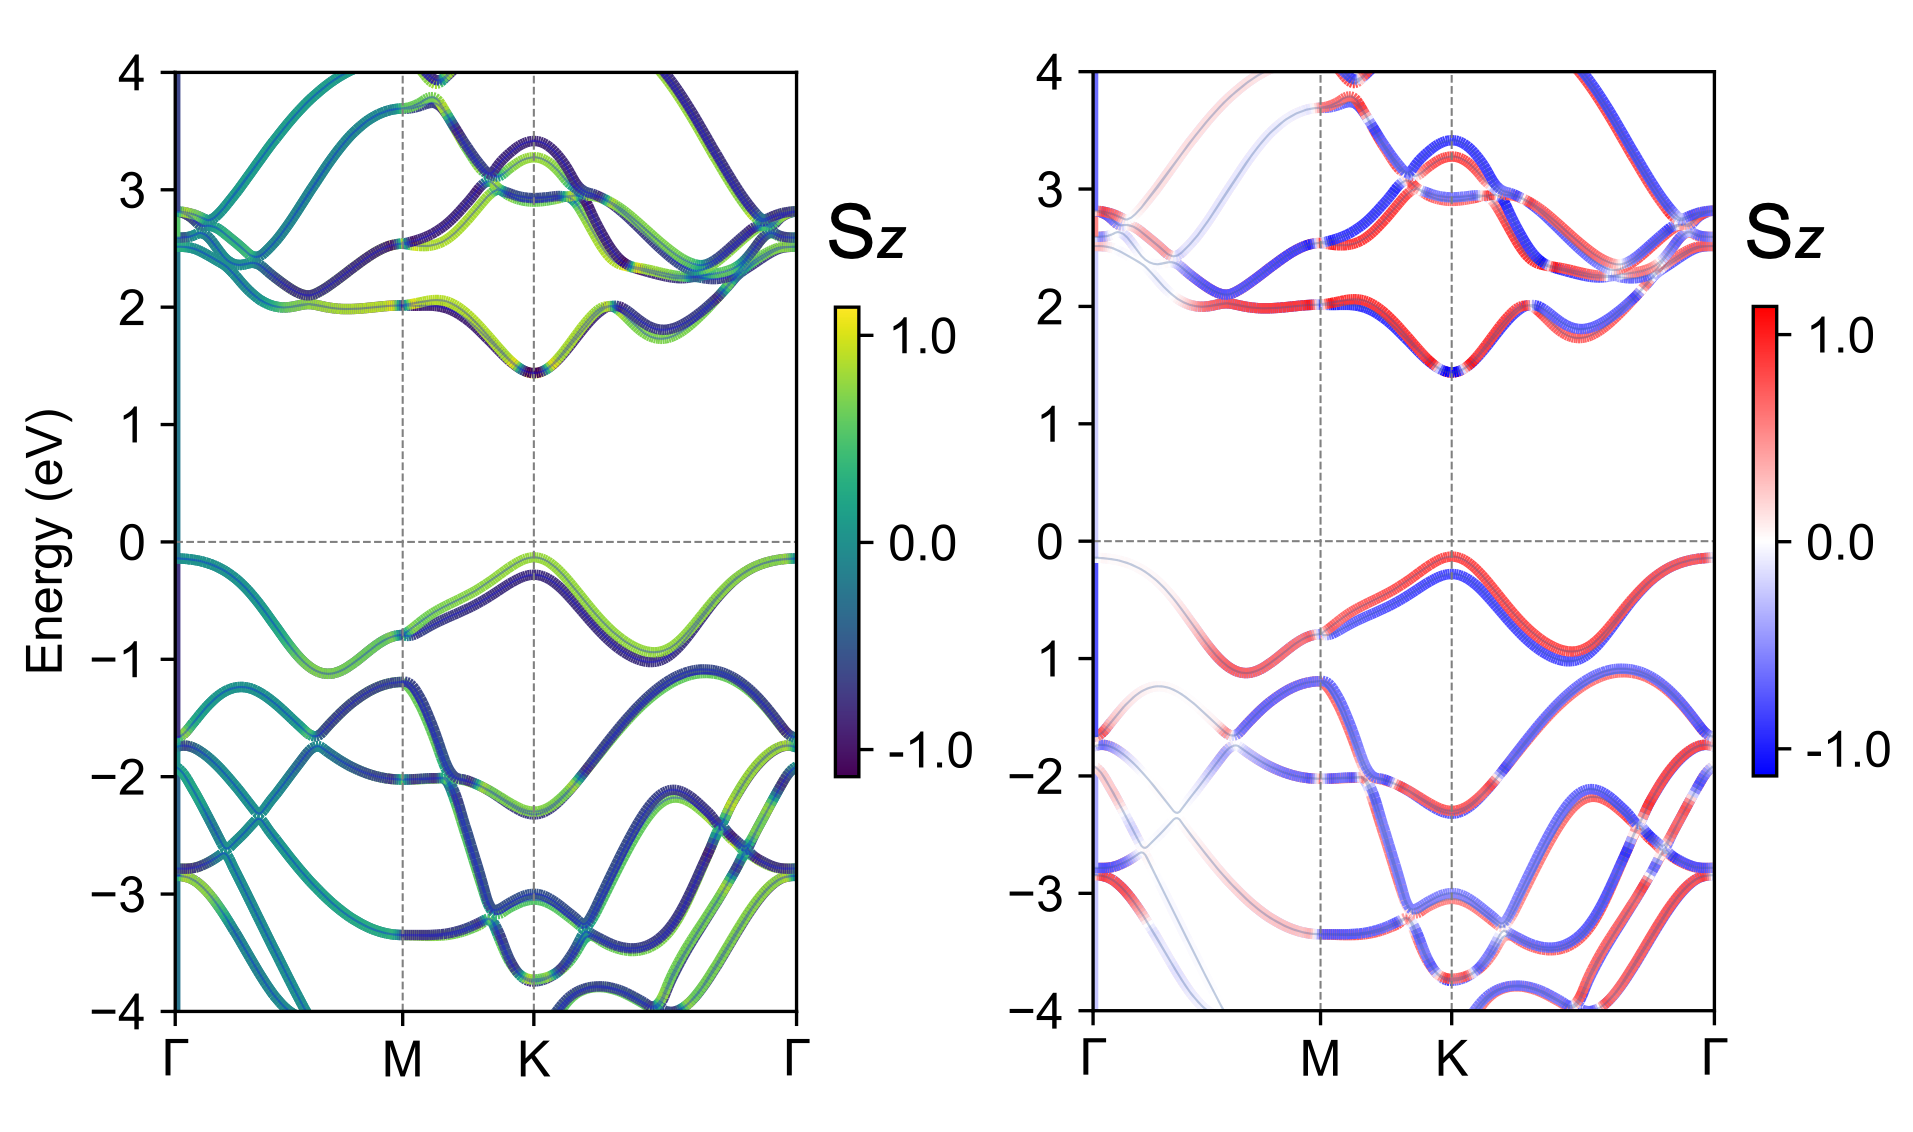
Spin-projected band structure (Ver. 1.4.0 and later)